Categories
Separate input and output
We advise you to distinguish separate input and output sheets as well as sheets for calculations, documentation and dashboards.
When we read a book or a report or a website, we read from top to bottom and from left to right (and in some languages from right to left of course). Keep your (local) standard in mind when you create an Excel file and try your best to follow that structure both within the worksheets and between them.
Rule of thumb
Have you ever gotten a visit from an accountant? Did they check that one important spreadsheet that contains your investment plans? Maybe they asked something like: What are the input values? What assumptions are these calculations based on? Can you give an example of a calculation? Where are the conclusions?
This is just one of these moments in which you will benefit from a clear Excel model. The rule of thumb is: separate input & output. That’s the first major step to really improving readability and maintainability of any Excel file. When we zoom into this further, we see the following as the categories we would generally group worksheets in:
Input sheets
On input sheets: use only 1 table per worksheet. Differentiate between dynamic data that is gathered from external sources, for example imported data from a CRM system, and data that can be found within the spreadsheet, such as calculations. Place references as close to the data as possible and make them easy to read, by using a color coding for example. This will make your accountant very happy and will make your spreadsheets, in general, much easier to work with.
Calculation sheets
In the calculation worksheets you store information that doesn’t change on a regular basis. These worksheets are often somber and purely functional. The purpose of these sheets is to use input data to draw conclusions. Remember that a spreadsheet remains in use for an average of 5 years, so even in these sheets things can change, just make sure that the formulas are easy to read and to adjust.
Output sheets
In the output sheets, we give an overview of the conclusions that can be drawn from the input data and calculations. Make sure you use tables, charts and nice layouts. Also think about making these worksheets printable by changing the margins. This is especially important for managers and decision makers.
Documentation
There is one special category of worksheets meant for documentation. Use these sheets to explain the functionality of calculations and the source of input data. Other similar sheets to this are version management sheets and index sheets.
Dashboards
Some spreadsheet users love the use of so-called dashboards: worksheets that contain input, output and calculations together. While dashboards disrupt the flow of data, and the clear separation of input and output, they can be very insightful when modeling dynamic processes.
We do advise to minimize them, use a maximum of 1 or 2 (depending on the size of the spreadsheet) and make it clear that is concerns a dashboard worksheet.
Conclusion
It is important to recognize different roles a worksheet can play, and make deliberate choices when creating a spreadsheet. We often encounter mixed sheets that are messy and confusing.
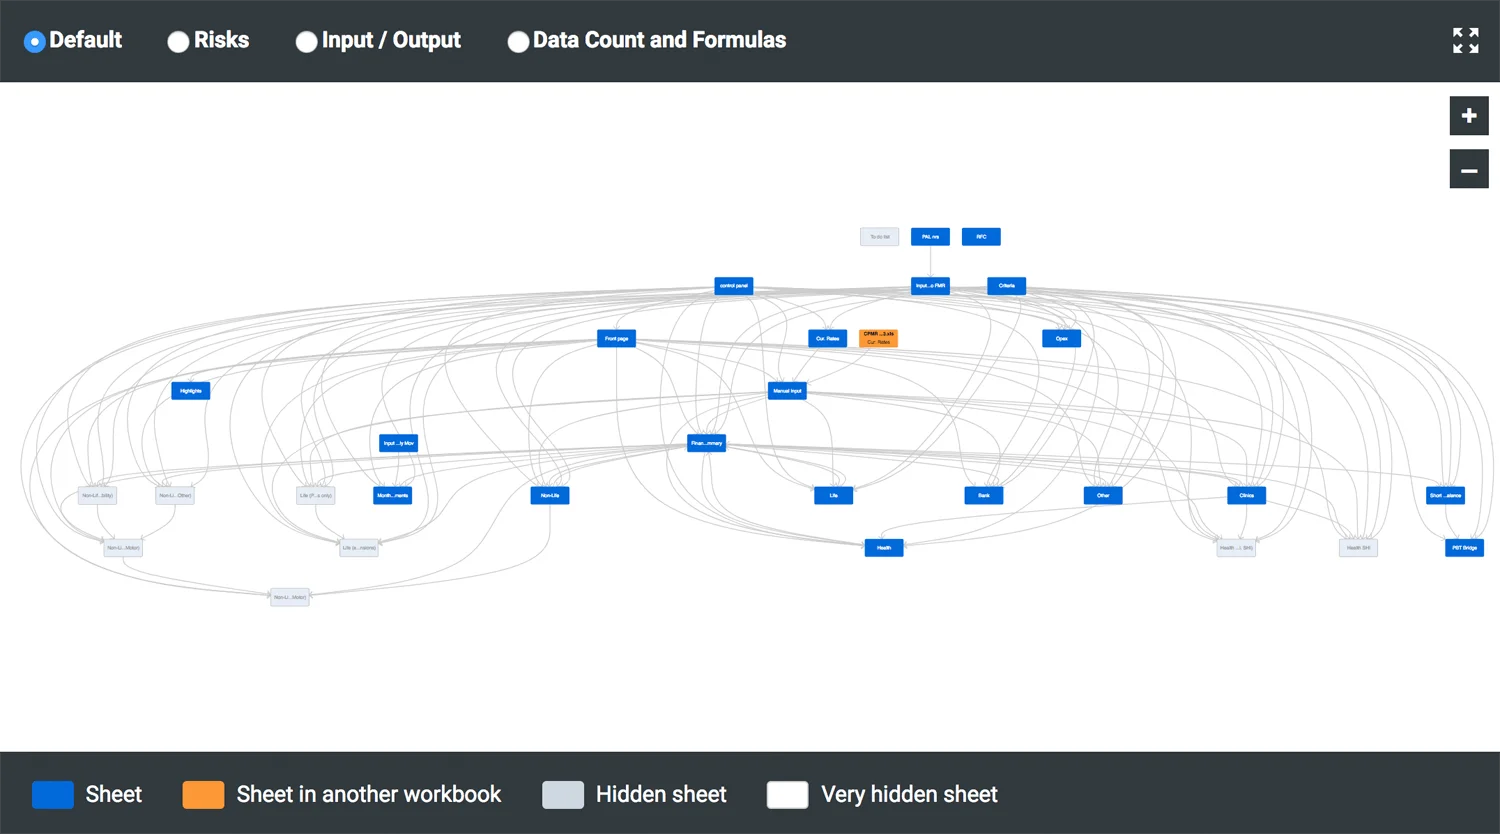
Do you want to learn more about the flow of your worksheet? PerfectXL Explore helps you visualize the dependencies between worksheets in no time.

Image: Spreadsheet visualization generated by PerfectXL Explore
