Categories
Structure changes: columns and rows
What happens when you add or delete columns and rows? It happens frequently in Excel and it changes the very structure of the sheet you’re working on.
Everyone with even the most basic understanding knows that Excel is made up of columns and rows. This coordinate system makes it much easier to find certain cells because, instead of something being cell 1248, it can simply be cell X52.
What happens when you delete rows or columns?
When you delete a row in Excel all cells shift up by one. Similarly with a column insert when all cells are shifted left. Either of these actions could result in hundreds or thousands of cells changing location. Of course the cells in the row or column no longer exist now, which also impacts any references to that row or column (the infamous Excel error #REF). Many formulas will update “properly” when a row or column is removed, as it will follow the shifted cell to its new location, but some formulas like VLOOKUP don’t update automatically.
All this being said, a simple row or column deletion could easily affect thousands or even hundreds of thousands of cells and formulas.
A simple example
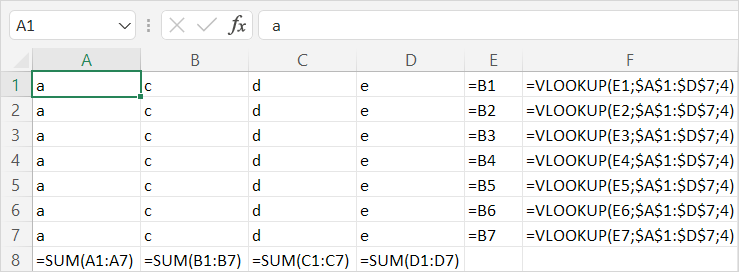
Here you have a simple table with formulas and data. Pay special attention to columns F & G (the cells in column G have a VLOOKUP function)

Table 1.1: VLOOKUP function in column G
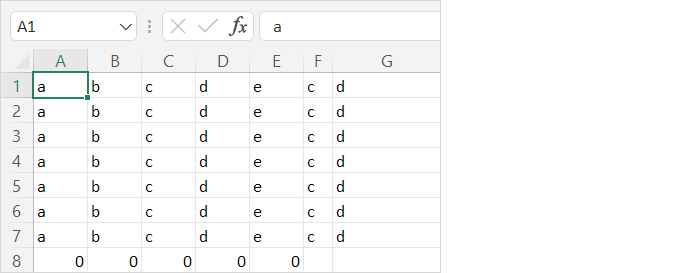
Now, if we remove column B, this happens:

Table 1.2: VLOOKUP function in column F after deletion column B
Not only is your data in a different location, but the references in and out of formulas also change. What is especially frightening is that the column index (4) in the VLOOKUP hasn’t changed. It’s now searching in a different table and the new column reference (to return the same result) should be 3. Take a look at the screenshots below with formulas view off. You’ll see that column F (E after shift) returns the same value with or without the column deletion, whereas the VLOOKUP (first in column G, then in column F) returns a different result:

Table 1.3: VLOOKUP function in column G

Table 1.4: VLOOKUP function in column F after deletion column B
How to treat a structure change?
Now we’ve seen what can go wrong within Excel itself, but many Excel users also use external tools (like comparison tools) for things like logging or version management. Here you run into another problem… How many changes to I actually report? In the example above (table 1.1) we referenced earlier column B (containing 8 cells) was removed (table 1.2). This resulted in a shift, meaning 40 individual cells shifted to the left. Not just that but the references in 3 SUM formulas, 7 direct references, and 7 VLOOKUPS changed. This means that in total 57 individual changes could be measured for this tiny little table. If you do some simple extrapolation you’ll quickly notice that in a “normal” Excel model one simple column insertion or deletion could easily result in thousands of individual changes, when in reality only one thing was done… a column was deleted.
PerfectXL Compare
PerfectXL Compare compares two spreadsheets and reports back on the differences. Other compare tools track column and row changes as well, but PerfectXL Compare also tracks worksheet adjustments and it goes far further in capability of performance and handling complex models. Our tool will, very simply, track 1 column insert or deletion when 1 column is inserted or deleted so you can actually do something with the results of a comparison! Nobody I know can do anything with 40,000 changes, that’s why we take the needle out of the haystack and show it to you. Read more about PerfectXL Compare or read about our evaluation of other market leading Excel comparison tools here.
