

Quick scan for risks and blunders
When there’s a rush to deliver or review a model, there’s not enough time to manually check all data and calculations. Still, you need some level of assurance. With PerfectXL, you can quickly check for major risks, such as broken formula ranges, incomplete references, and whether external sources are used properly. You can extend or simplify this scan as needed.
- Download the sample file to follow the steps.
- Already working with PerfectXL? Then jump to the solution with PerfectXL.

Step-by-step without PerfectXL
Step 1a: Identify risks to check for
When you feel doubtful about calculations made in a model, or when you have multiple models to review, but limited time to asses them it is nice to have something to hold on to. Without PerfectXL, it’s extremely difficult to quickly gain sufficient control over an Excel model to identify core risks. Specifically, you will want to manually check for presence of the following risks:
- Approximate lookup
- Calculation Set to Manual
- Circular Reference
- Excel error
- Data Validation Rule not Followed
- Double Count
- Double Operator
- Excel Error
- Formula Interrupted by Data
- Formula Interrupted by Other Formula
- Iterative Calculation Enabled
- Longer Cell Reference Expected
- Numeric Text Calculation
- Reference to Empty Cell
- Unnecessary Space
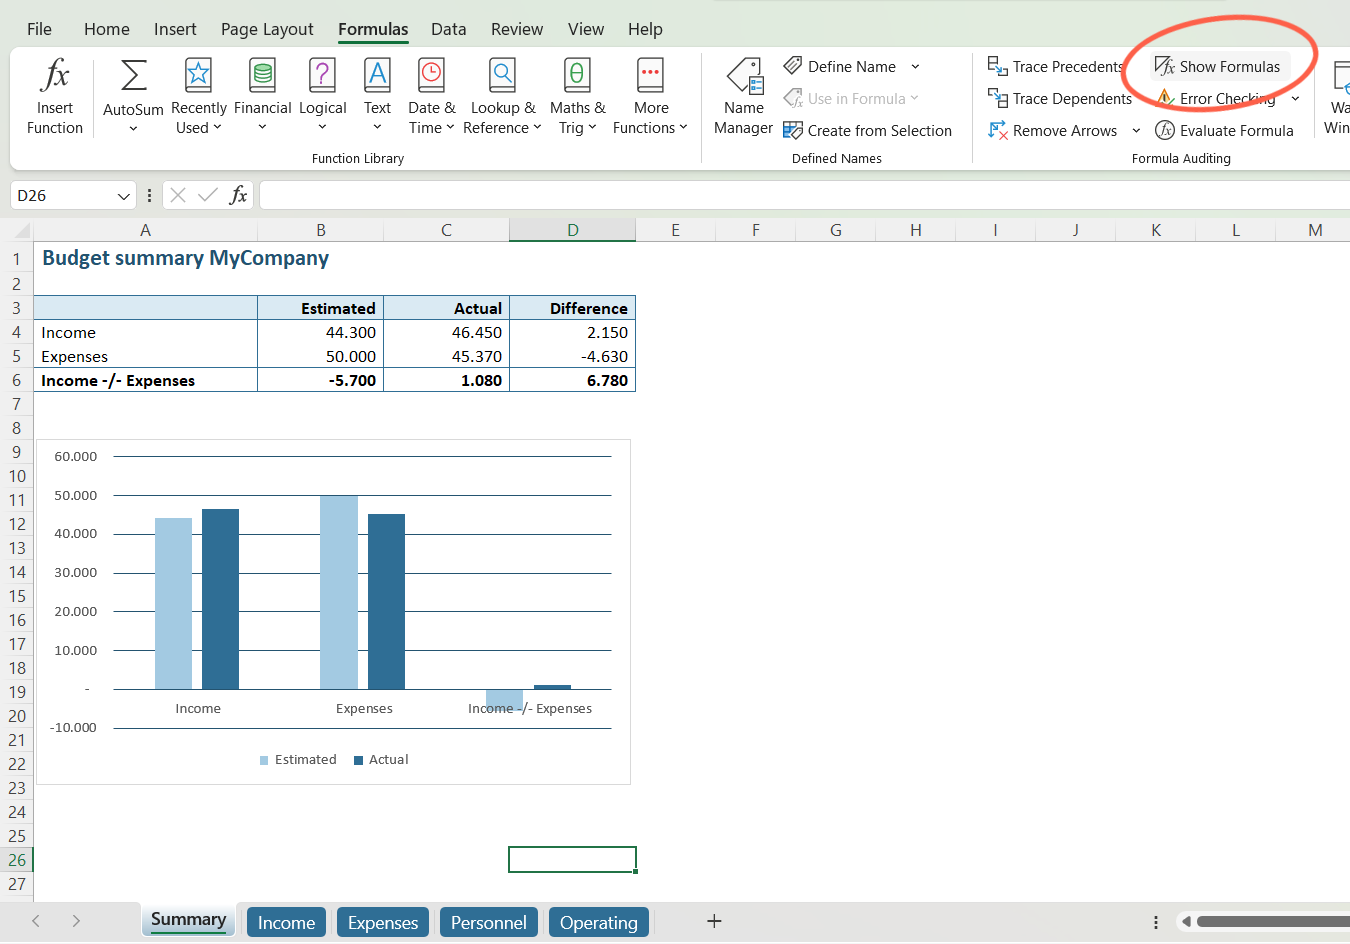
Step 1b: Show all formulas
Start with the “Show Formulas” button under “Formulas” in the Excel main menu.
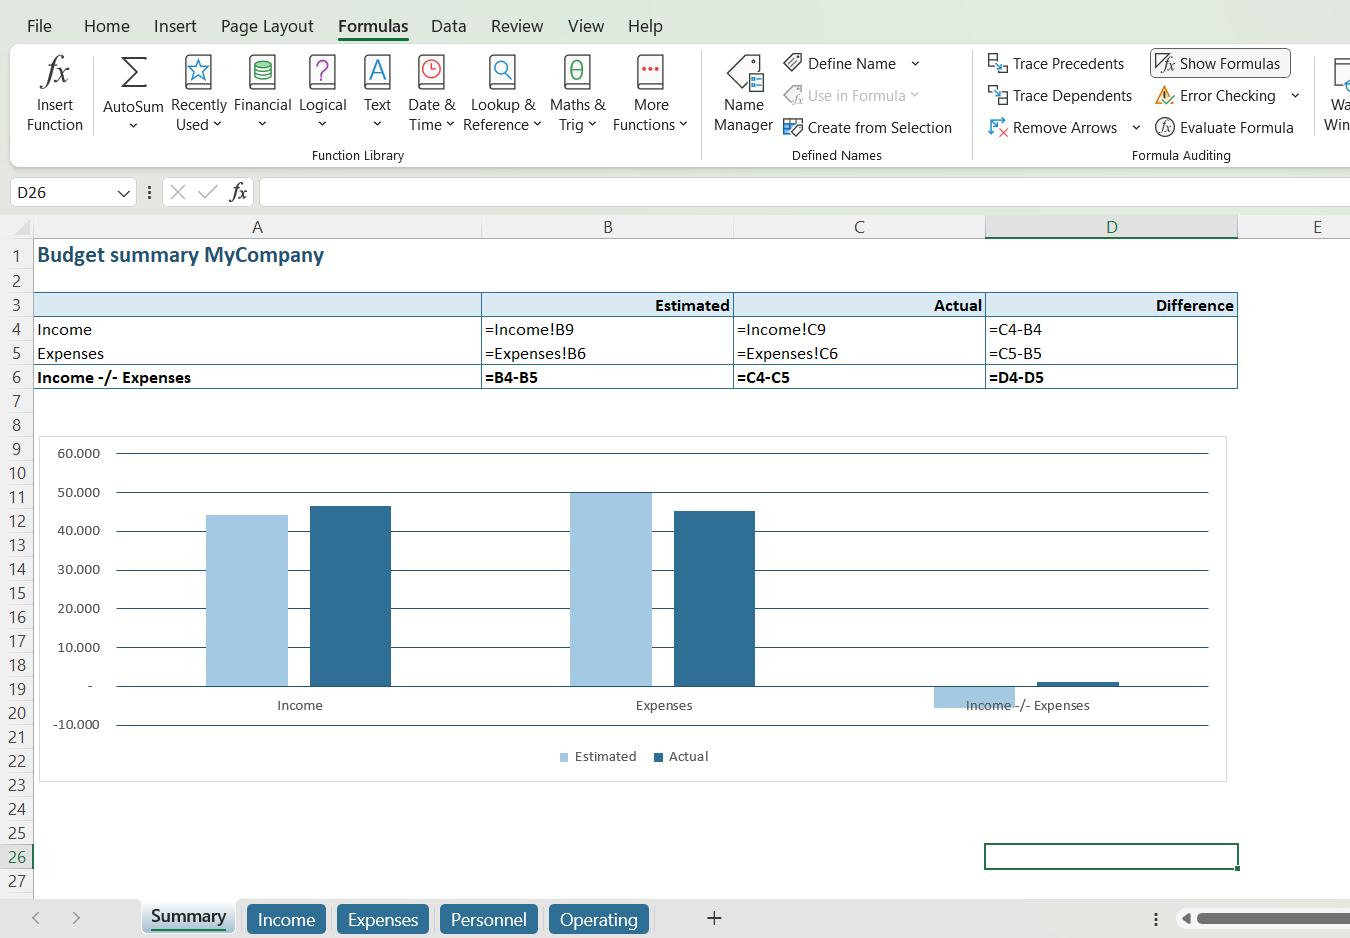
Stap 1c: Visible formulas
When you click this button, the cells that normally contain the result of a formula will now display the formula itself.
Step 2: Scan for irregularities
Once the formulas are visible, you can visually scan for irregularities. Repeat this process for each tab.
In the example model with five tabs, cells with formulas are highlighted in yellow for convenience.
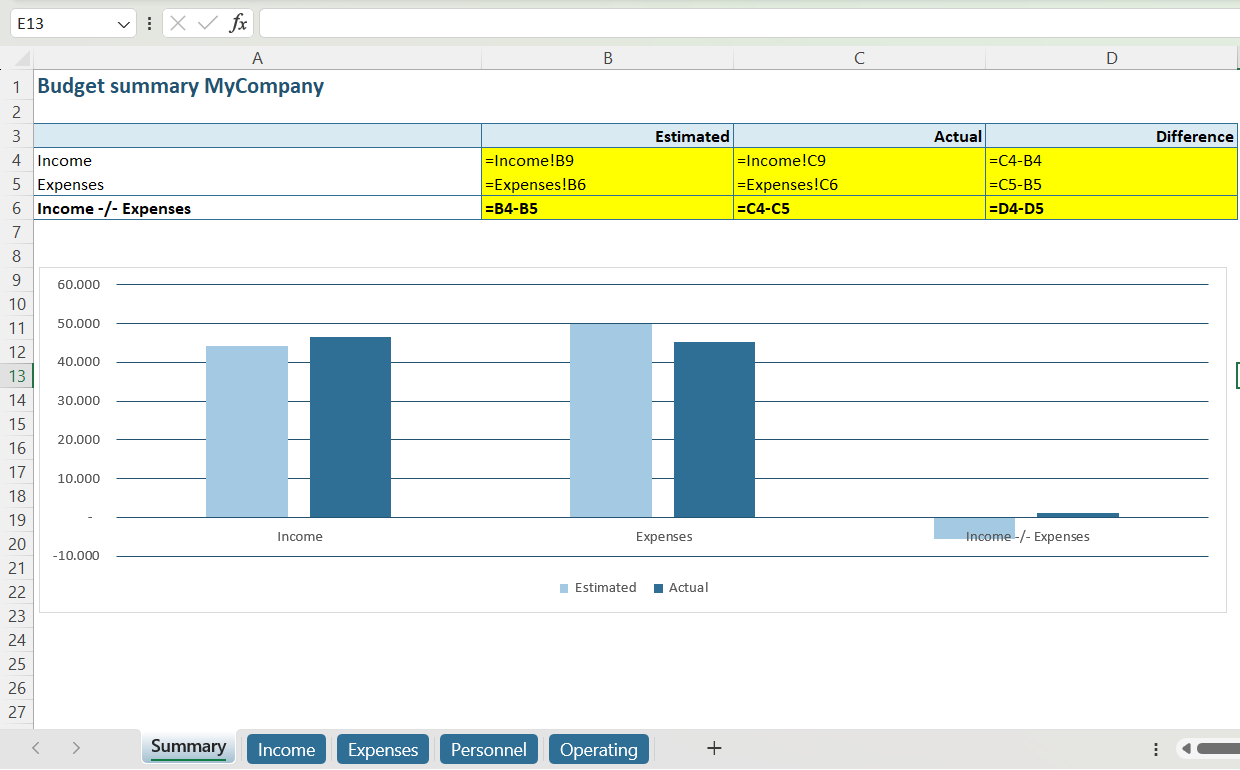
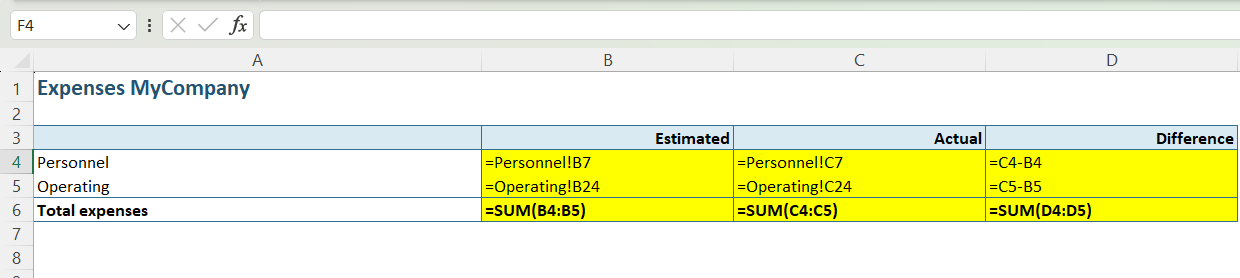
On the “Summary” tab, we see nine formulas, with four referencing cells from other tabs and the remaining five being simple subtractions. Nothing requiring immediate attention here.
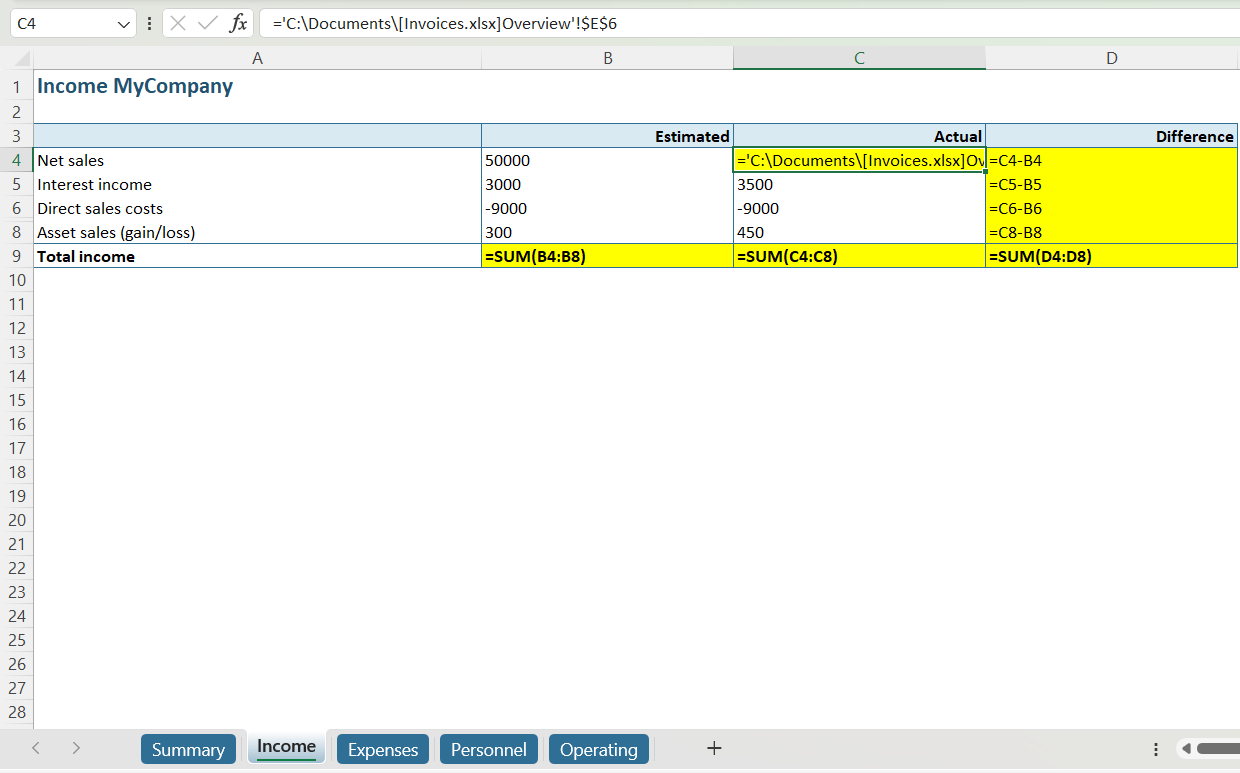
On the second “Income” tab, we observe a reference to another Excel file in cell C4, four simple extractions in column D, and three additions in row 9. With a naked eye, we can see consistent formula ranges in both column D and row 9.
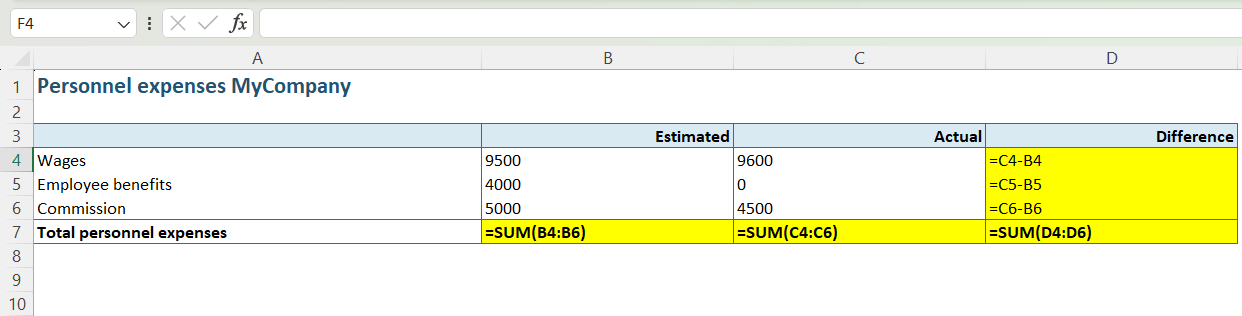
Similarly, on the next two tabs, no irregularities are observed.
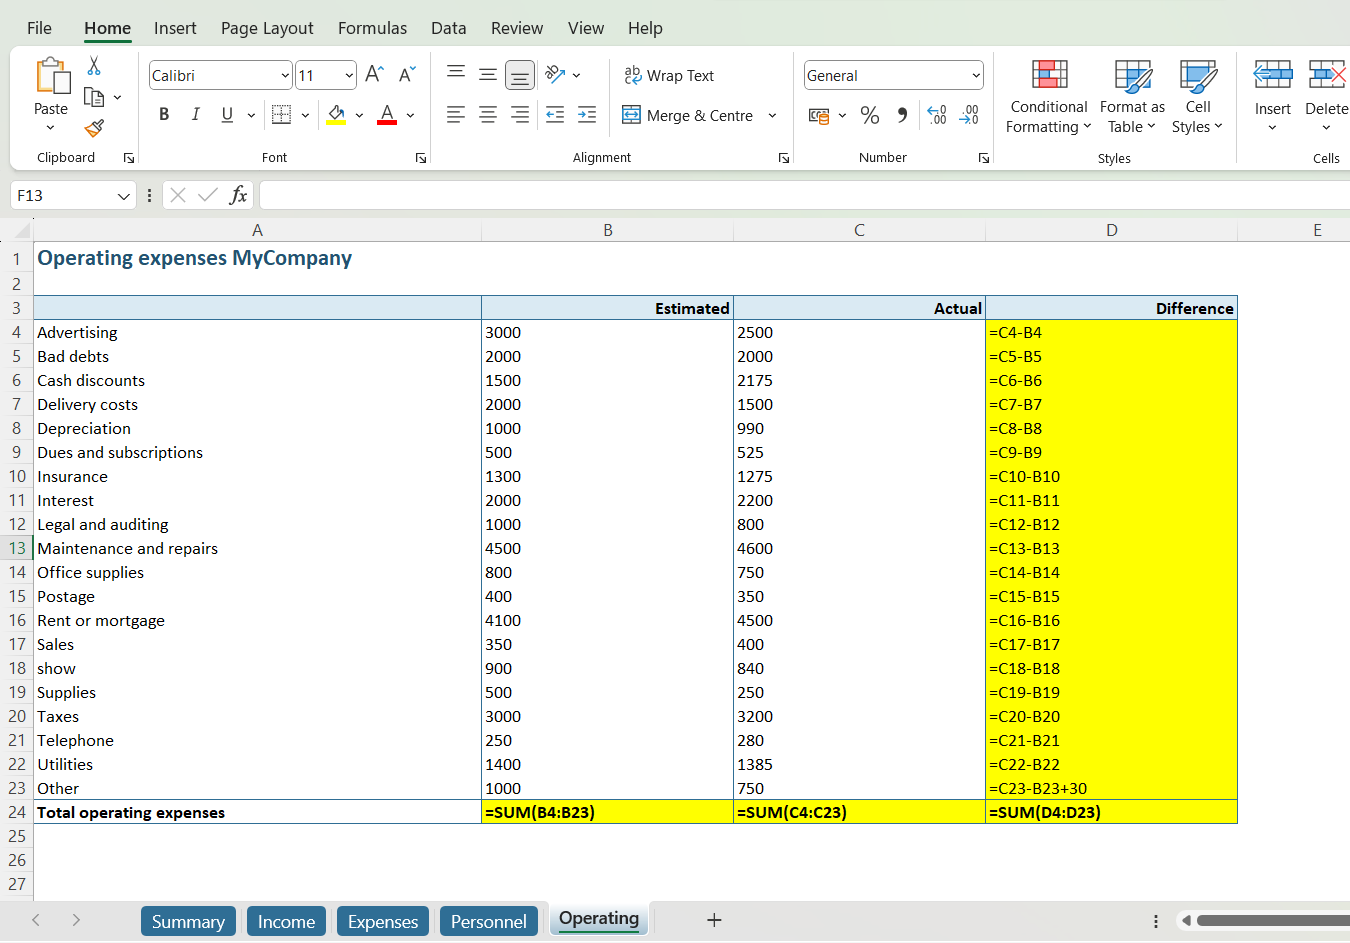
On the last tab – “Operating” – however, we notice something that needs our attention. Column D contains a formula that appears to be intended to be extended, but it’s interrupted, as the subtraction =C[ ]-B[ ] appears in all cells except for cell D8, which contains a ‘0’. It seems that we have interrupted the extended formula by entering a hardcoded number. This is likely an error!
Furthermore, in cell D23, there’s another type of interruption. While all other cells in the column follow the pattern “=C[ ]-B[ ]”, cell D23 contains the formula “=C23-B23+30”. Again, a hardcoded number is present, but this time it’s added as a value to the formula.
Step 3: Evaluate and improve findings
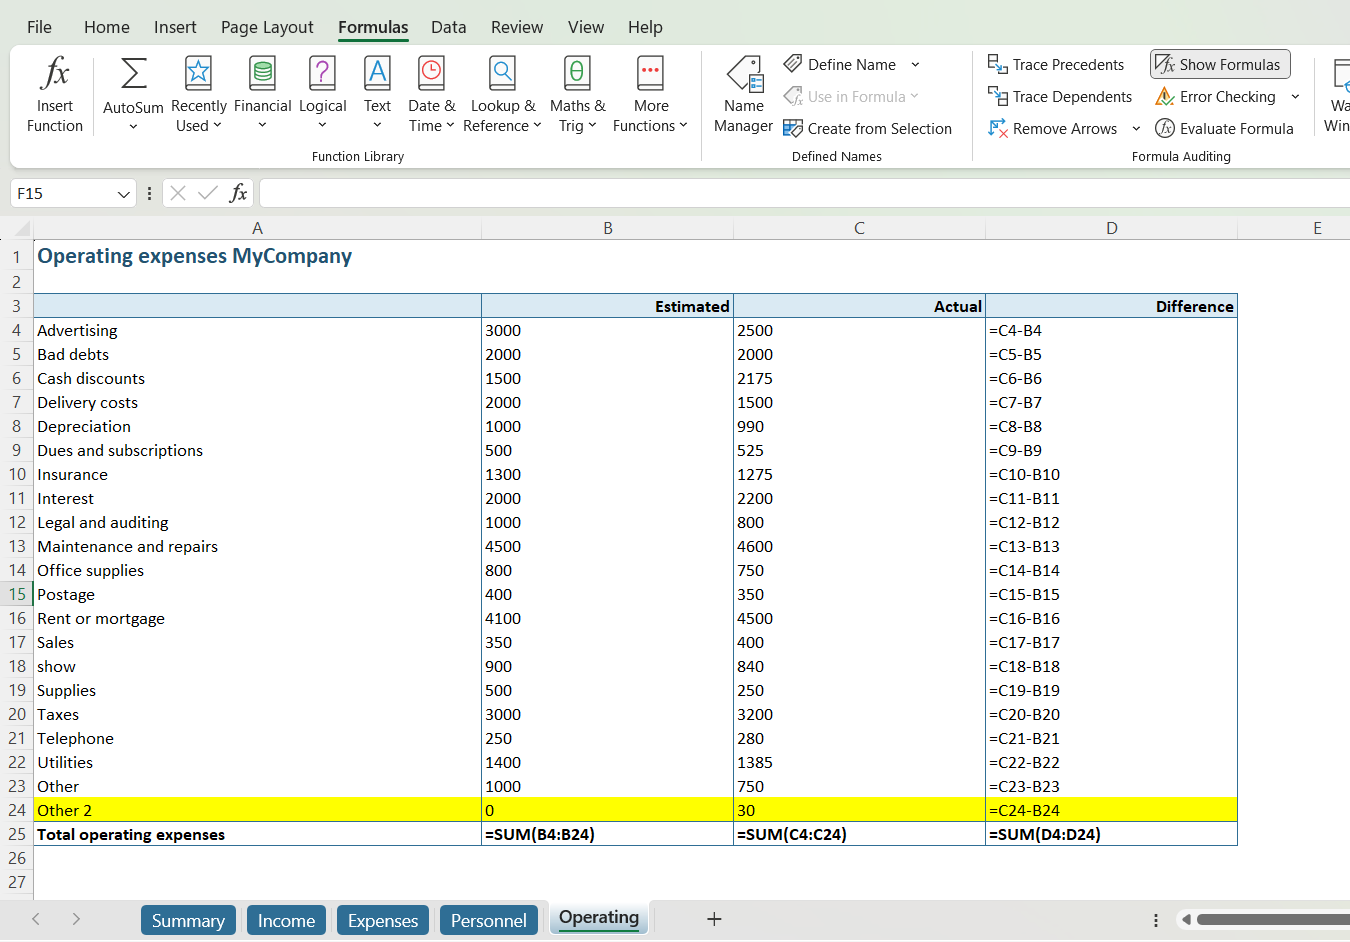
You, as the user, need to decide whether this ‘+30’ belongs there or not. In our case, the ‘+30’ represents unforeseen costs, but presenting these costs in this way is unclear. It’s better to add a new entry for unforeseen costs and then extend the formula accordingly.
Now that a row has been added to the table, it’s crucial to check in the last row, “Total operating expenses,” whether the cell range for the sums is still correct (i.e., whether the new row is included in the total). Fortunately, in our example, this has been done correctly.
Conclusion
Our example is only a small and very manageable model, but you can imagine that such an investigation in more extensive models is extremely time-consuming. It takes days to go through an Excel file sheet by sheet and cell by cell, and often, you don’t have that time. Additionally, there are various problems that you can’t easily make visible, such as the location of a circular reference, the location of broken external links, hidden elements, or unintended white space.
Step-by-step with PerfectXL
Step 1: Open the model in PerfectXL Explore
Check for:
- Connections between sheets that you believe are necessary;
- The correct external sources being called;
- Whether the charts contain relevant information.
The visualization of our concise exemplary model shows us that both the “Personnel” and “Operating” sheets refer to “Expenses” and that both “Expenses” and “Income” refer to “Summary.”
Furthermore, we see that external source “Invoices.xlsx” is called by the “Income” sheet. This all looks perfectly fine.
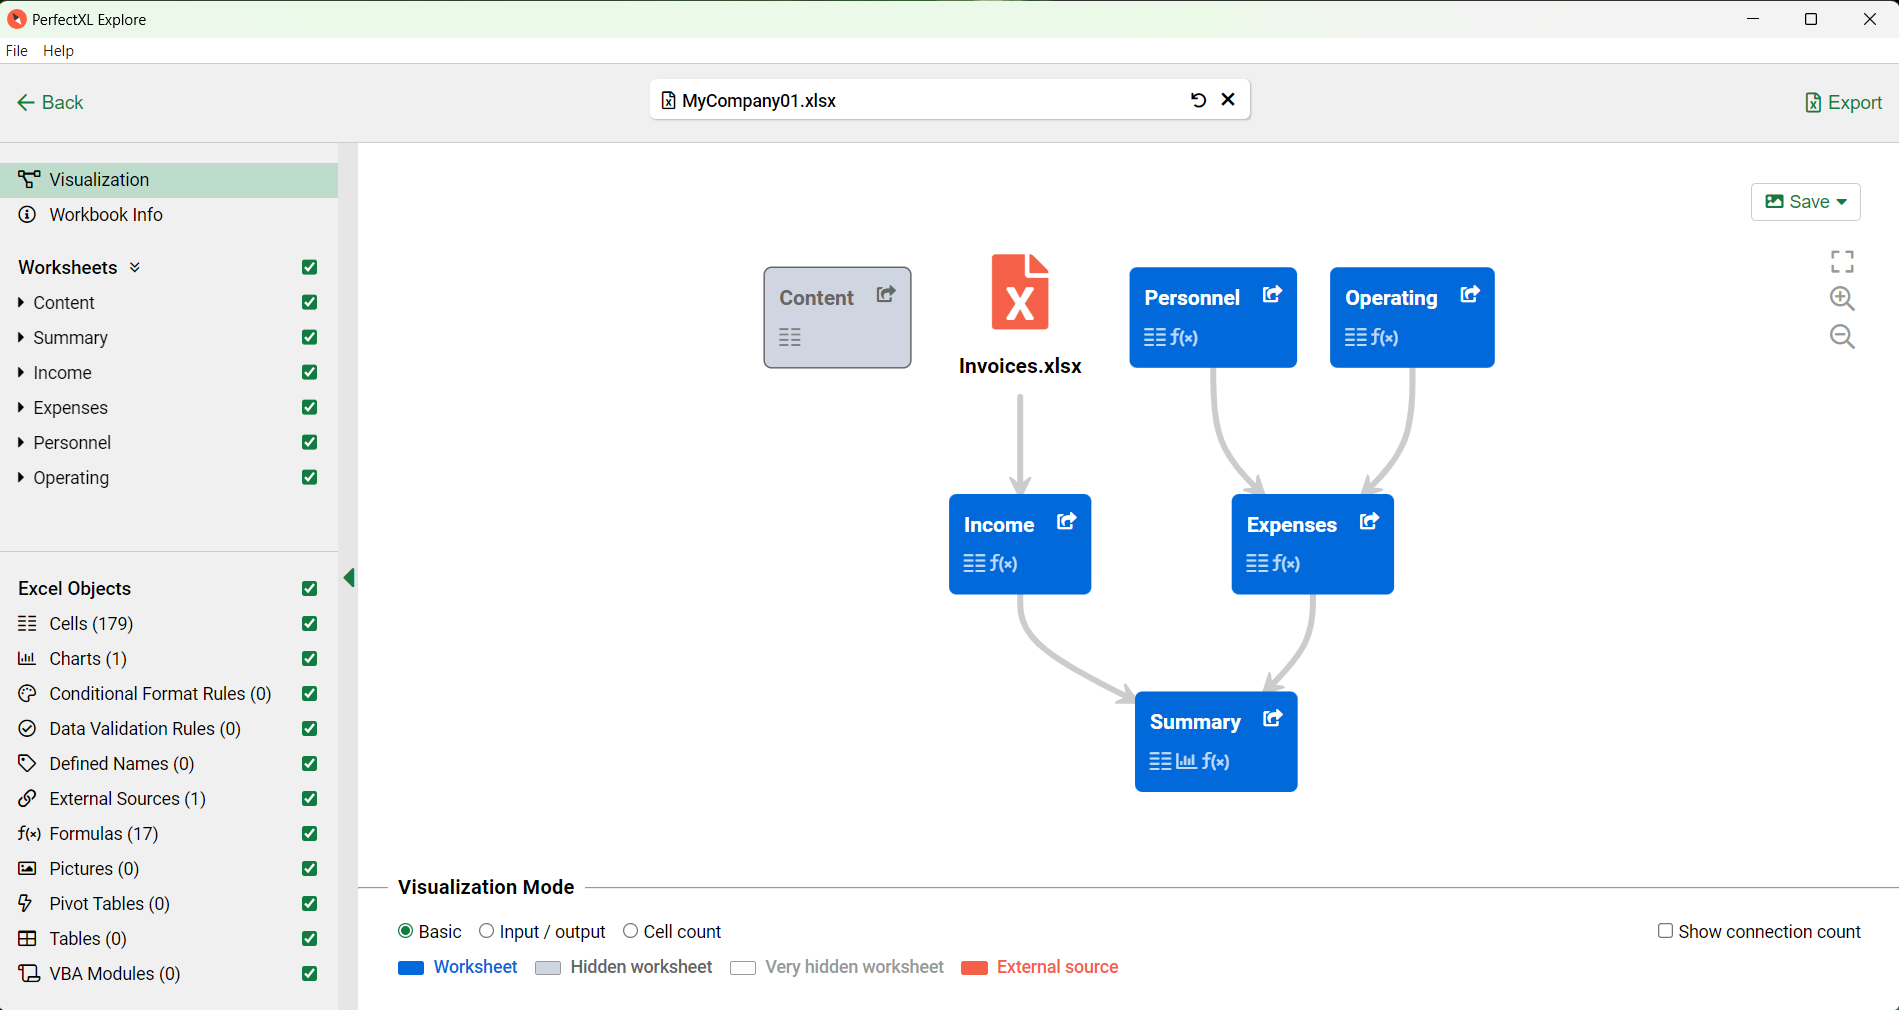
But there is another tab that we didn’t spot using the manual method: “Content”. The grey color reveals that this concerns a hidden worksheet and the fact that there are no arrows that lead to or from this sheet indicates that it doesn’t contain any relevant information for our model. This assumption makes it useful to manually inspect the worksheet.
Click the external link icon in the top right corner of the grey box to jump to the relevant location in your model right away.
A pop-up will appear asking you if you would like to unhide the worksheet first.
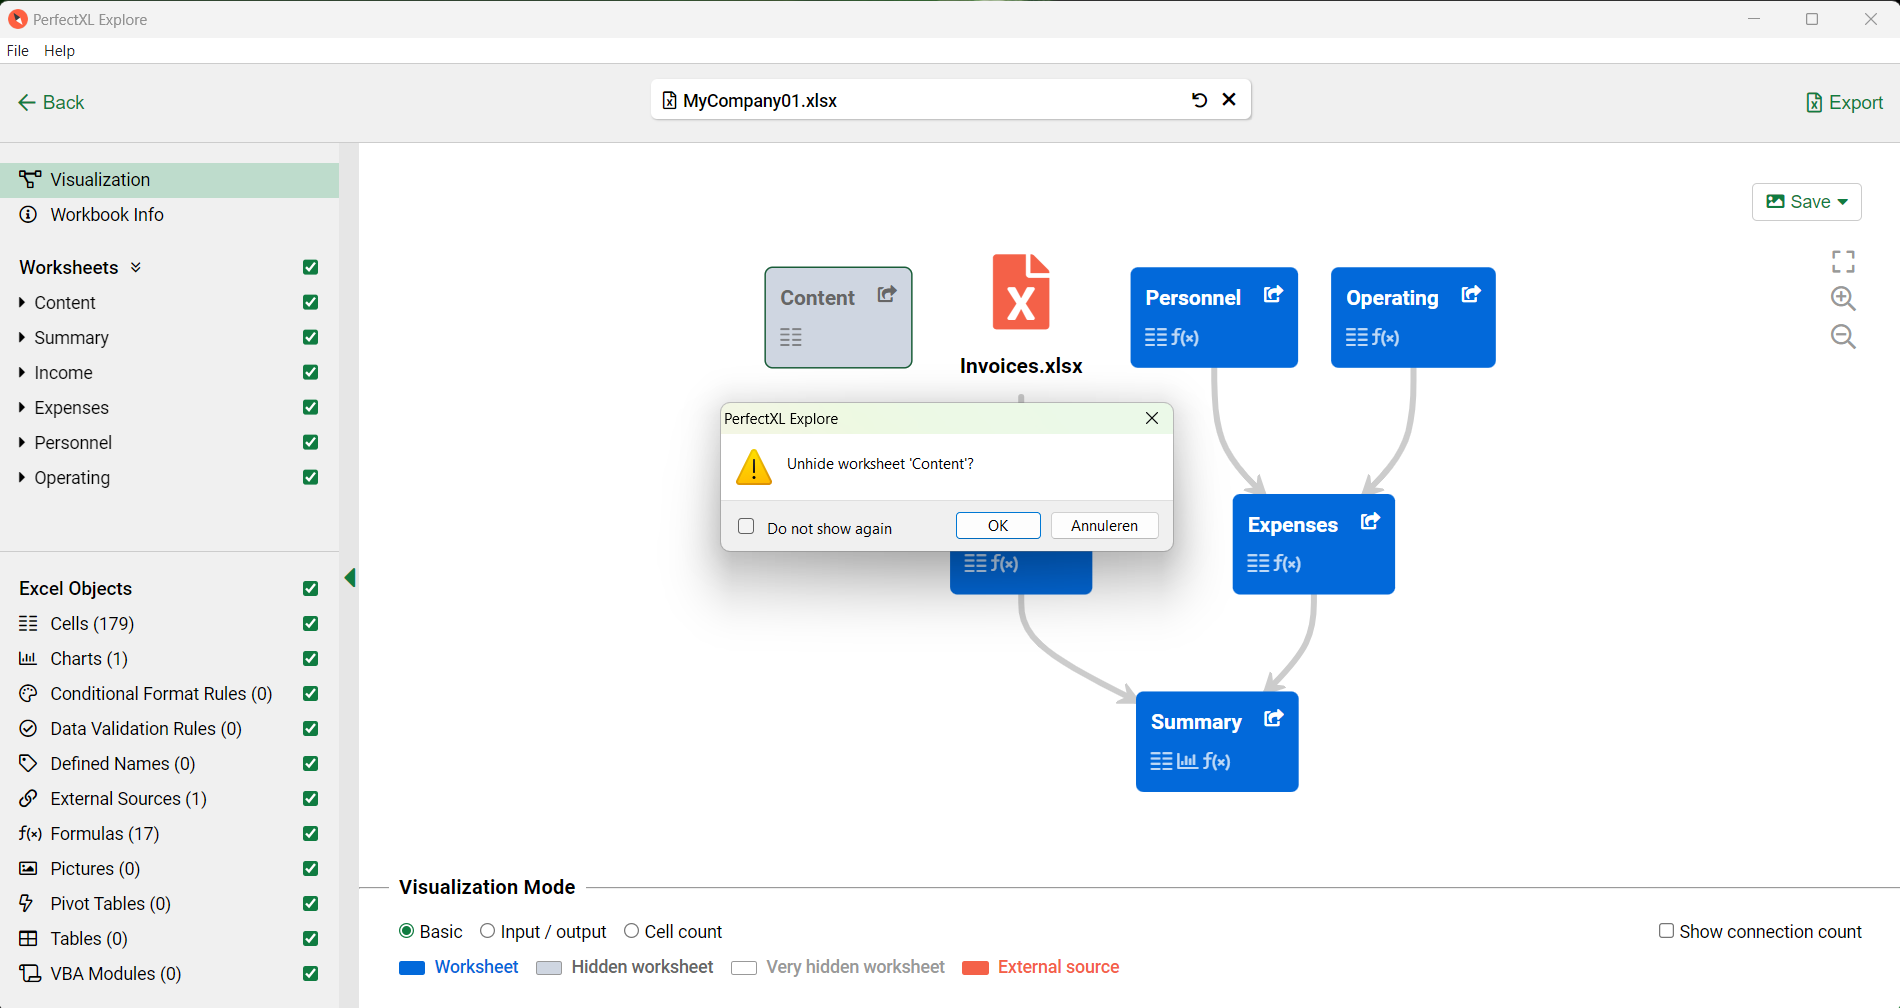
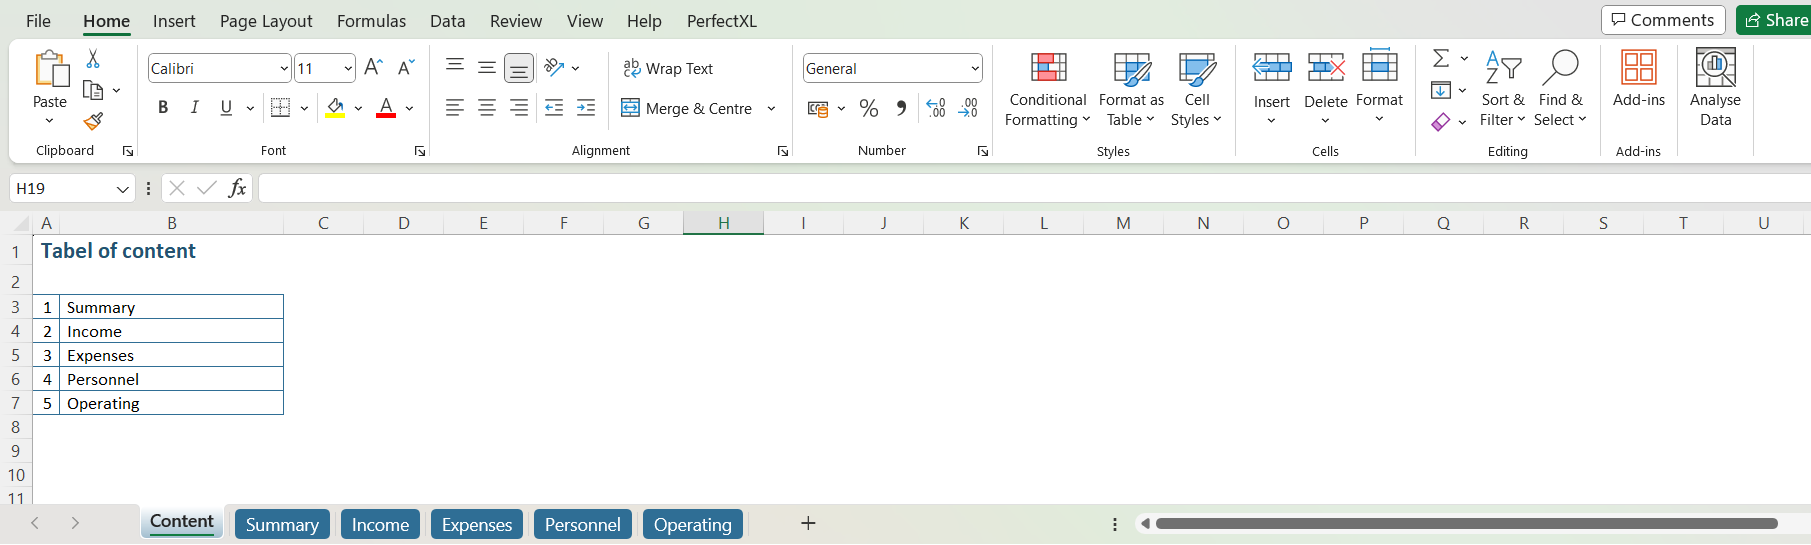
As soon as you click ok, the software will take you to the worksheet, which is then no longer hidden.
The worksheet turns out to be a table of contents of the model, so it is not problematic as long as it stays unhidden (so don’t rehide it).
Step 2: Open the model in PerfectXL Risk Finder
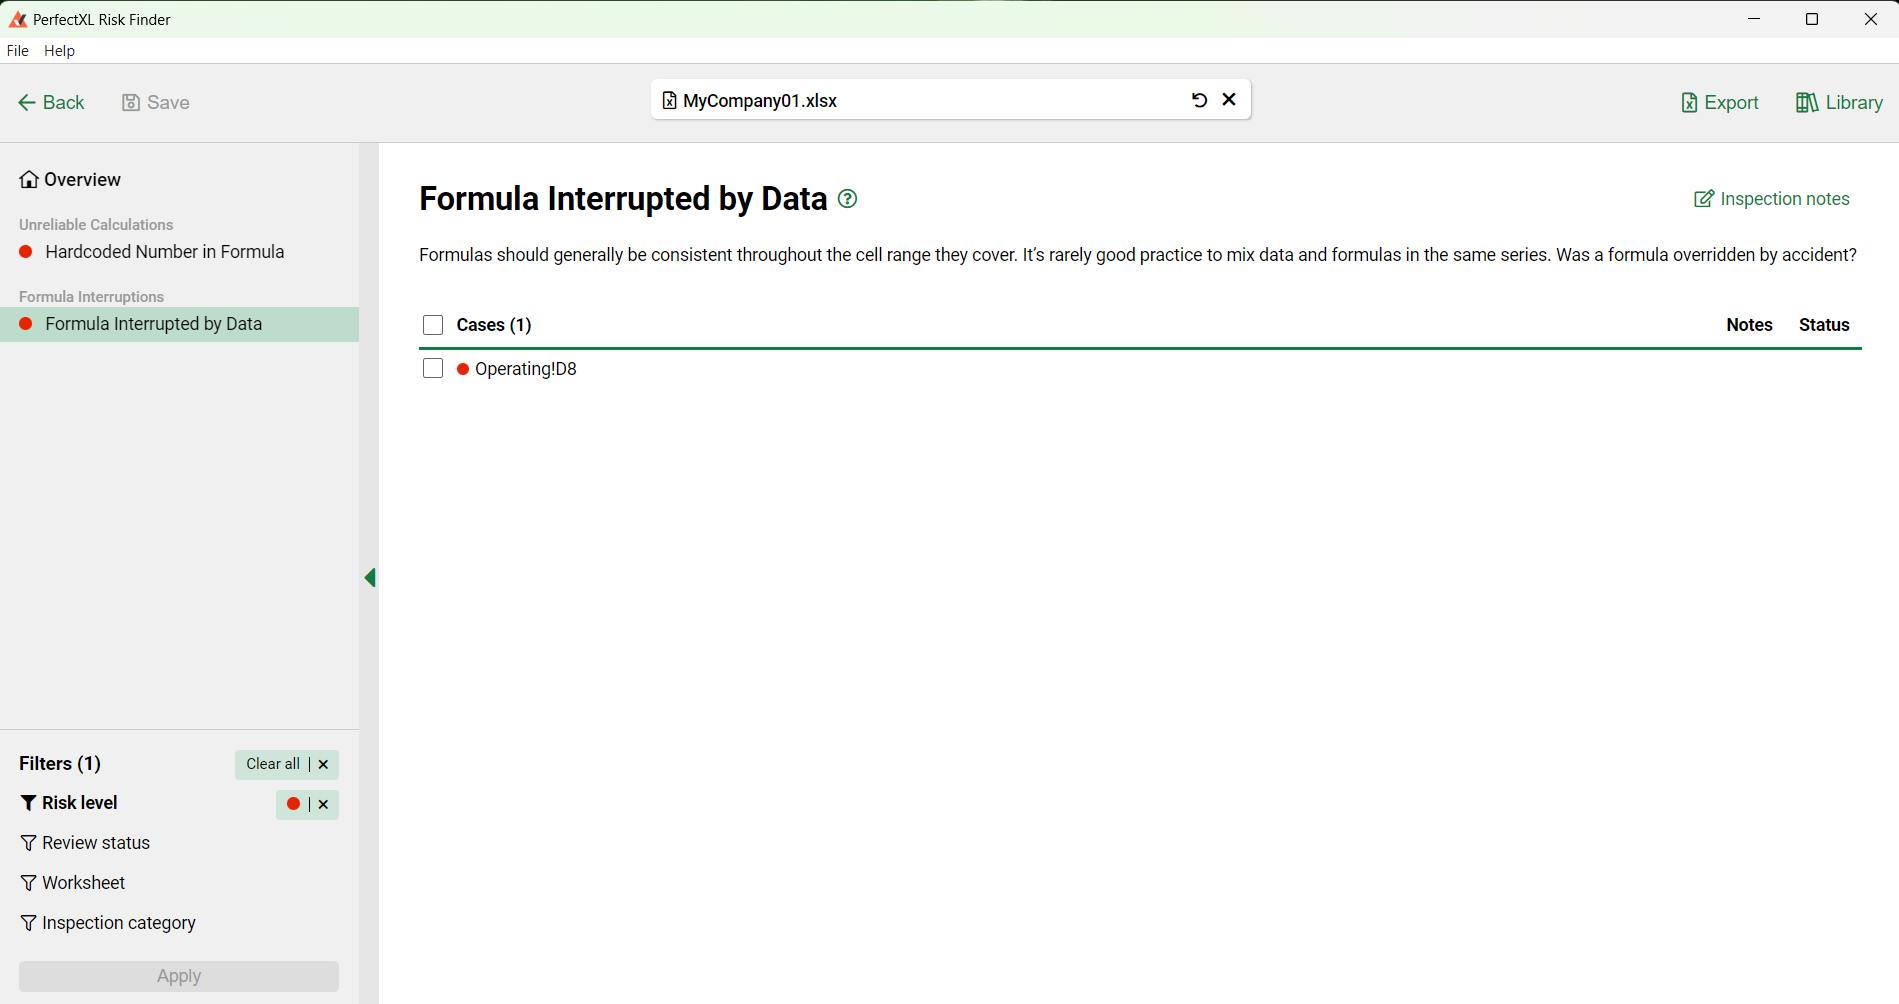
Filter at the bottom left on Risk level: “Risk” and go through the risks one by one.
Most of the risks you encounter can directly impact the outcome of the model. However, in some cases, something is a risk but not immediately wrong.
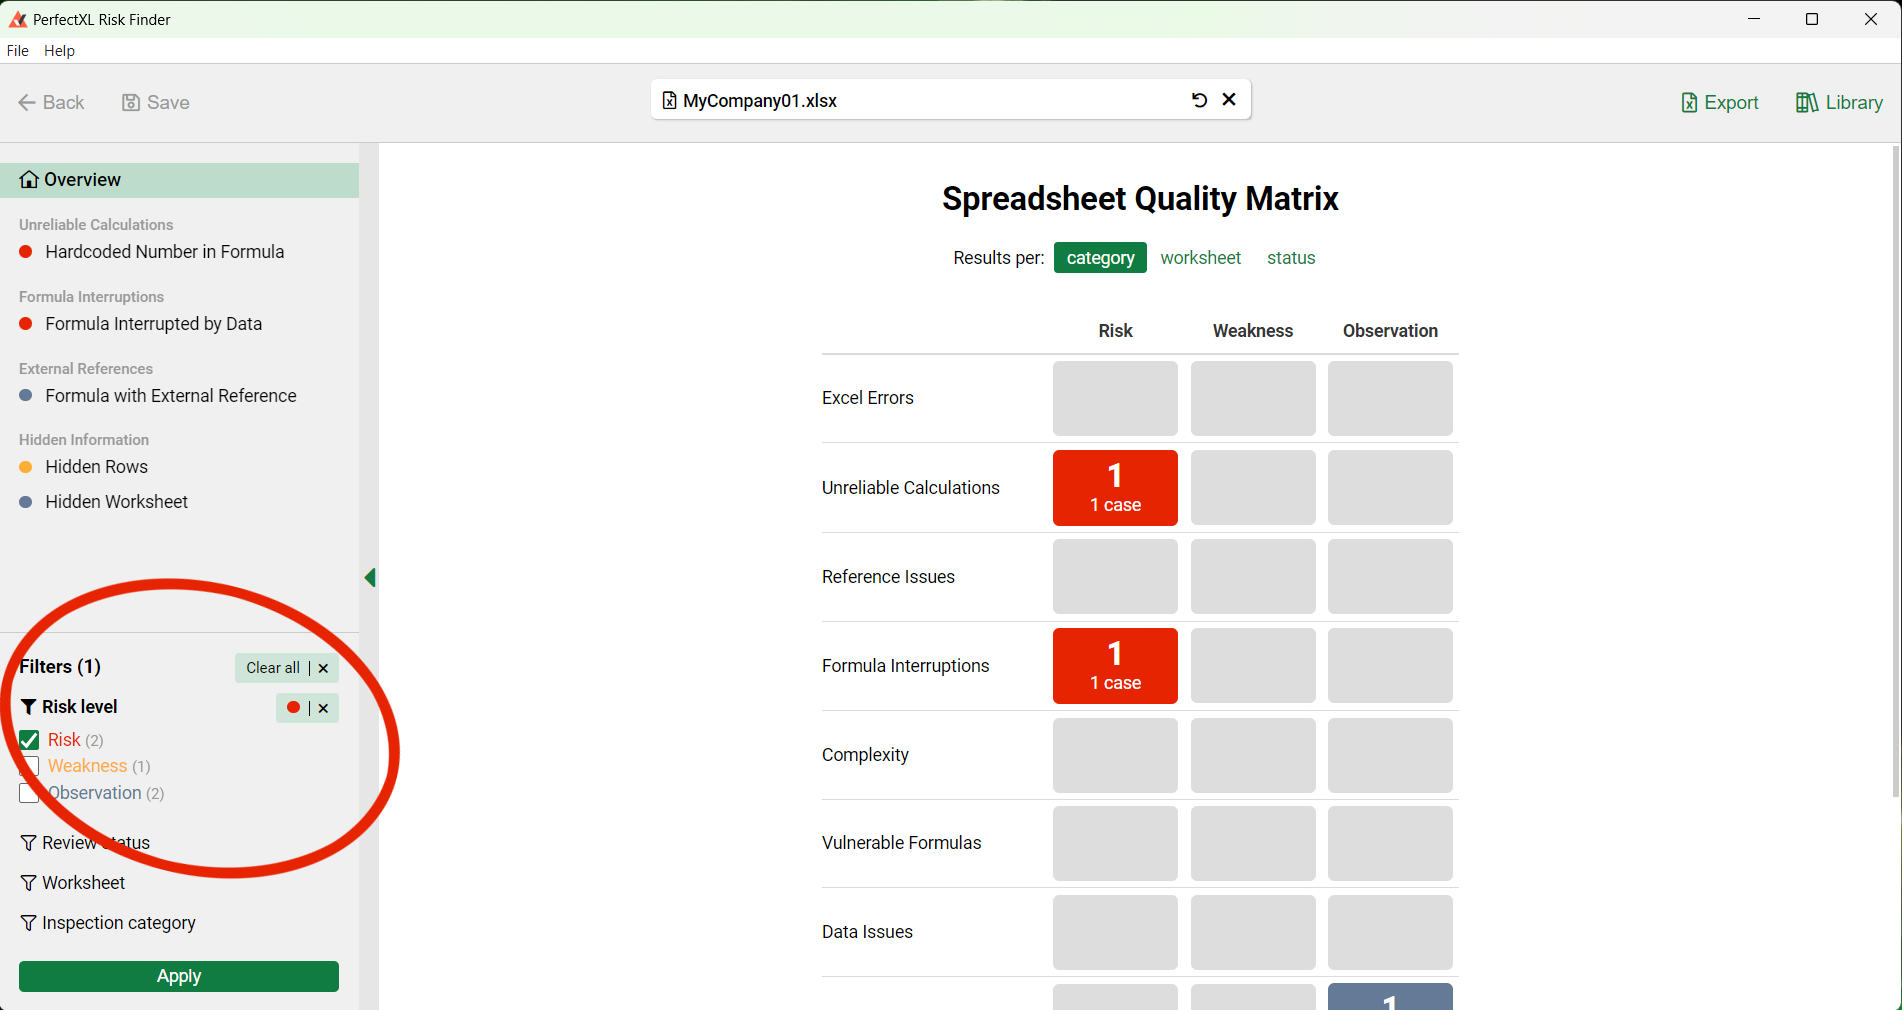 You probably want to check findings that have a potential to be a direct error. “Excel errors,” “Longer Cell Reference,” and “Formula interrupted by data” are very relevant in this case.
As you can see only one instance of “Formula interrupted by data” was found in our model: in cell D8 on worksheet “Operating”. If you would like to know more about this instance you can click the case for more details:
A fragment of the relevant worksheet with cell D8 highlighted will now appear in the frame. Underneath it you’ll find the description of the issue: “The formula range D4:D22 is interrupted by a value at D8.”
Due to the visual fragment and the description, it is easier to determine that a serious risk was discovered; this formula should have been extended throughout the entire range D4:D22!
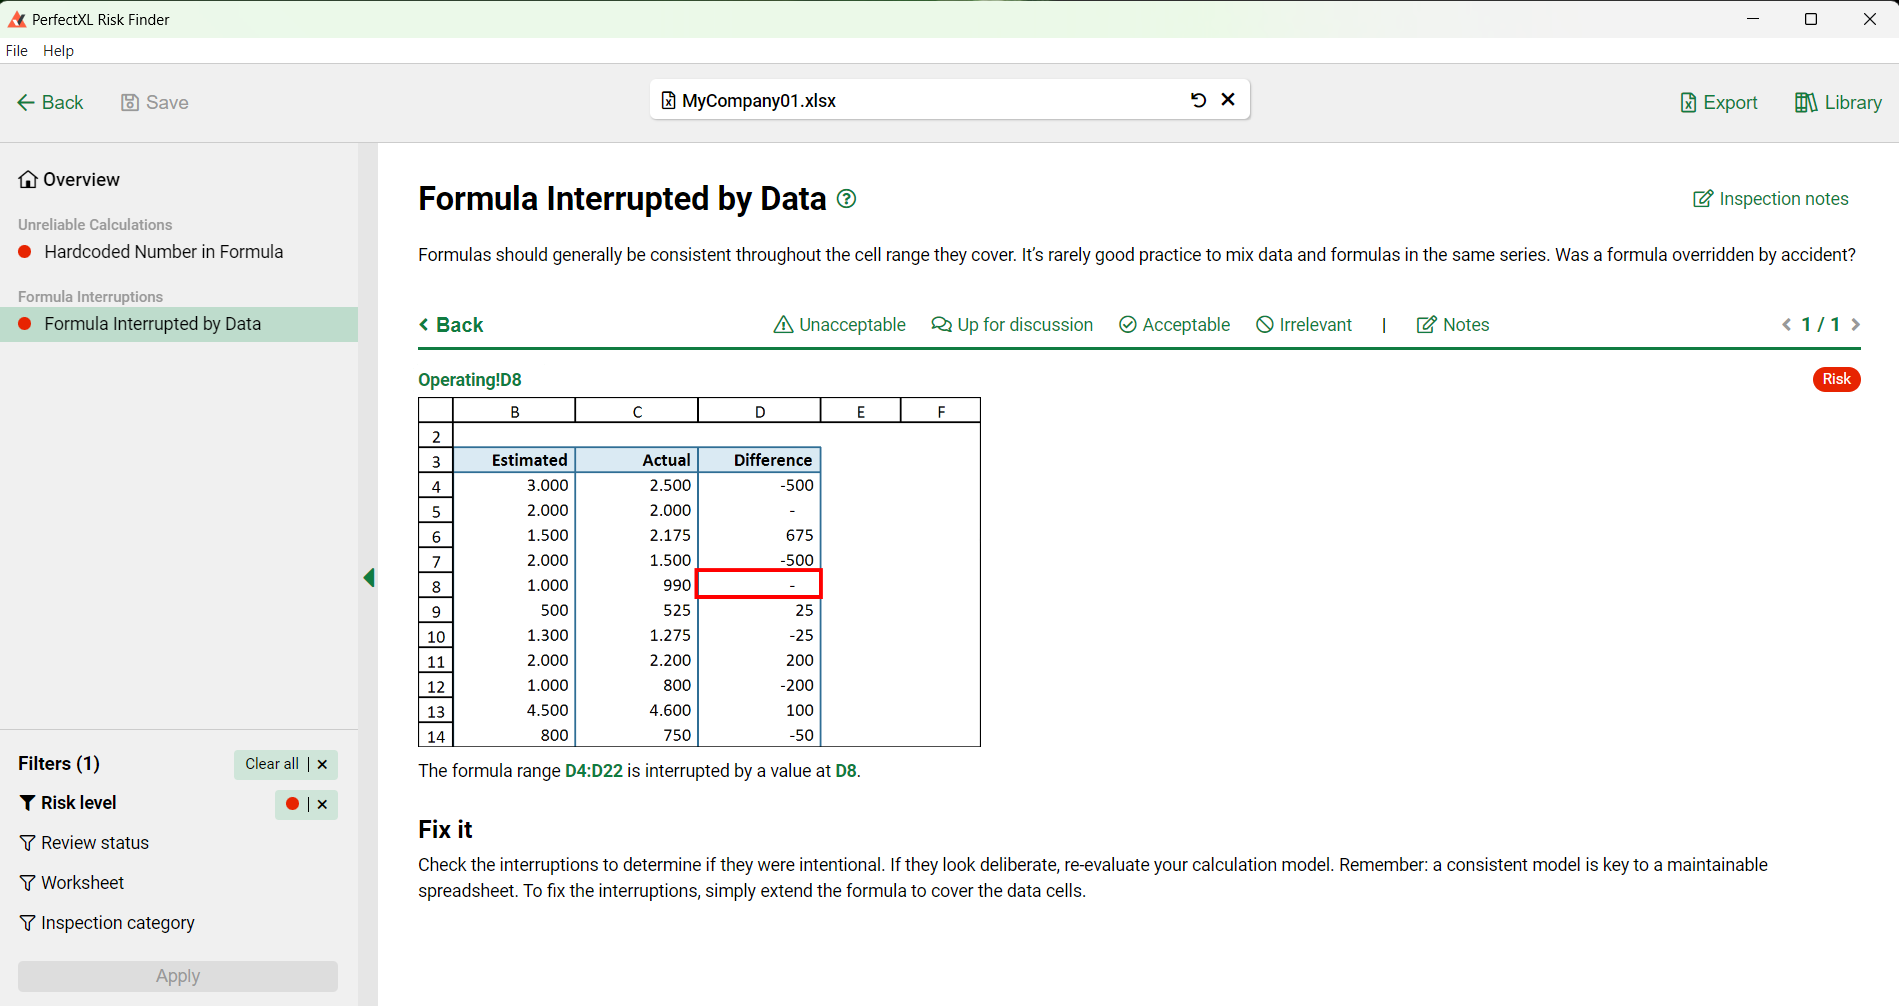
When you click the visual fragment PerfectXL Risk Finder will take you straight to the exact location of the issue in Excel: cell D8 in tab Operating, so that you can make the necessary adjustment.
Items like “Hard Coded Number in Formula” or “Many operations” are also important, but if you’re really short on time, you can ignore them. They influence the quality of a model but not the concrete outcome of a specific formula.
In the PerfectXL Risk Finder, you’ll find explanations on how to deal with each identified risk. There’s also a manual available (link) with a detailed description of each element.