Categories
Structure of Excel files: Best Practices
In this article we’ll discuss some of the best practices that will help you build Excel files with a logical and solid structure.
All Excel users want their files to have a solid and logical structure. The problem is that people tend to disagree on what a good structure looks like, or they don’t have time to structure their files well, or the file has been around for so long that the users don’t know what the structure was supposed to be.
Basic Rules for good modelling structure
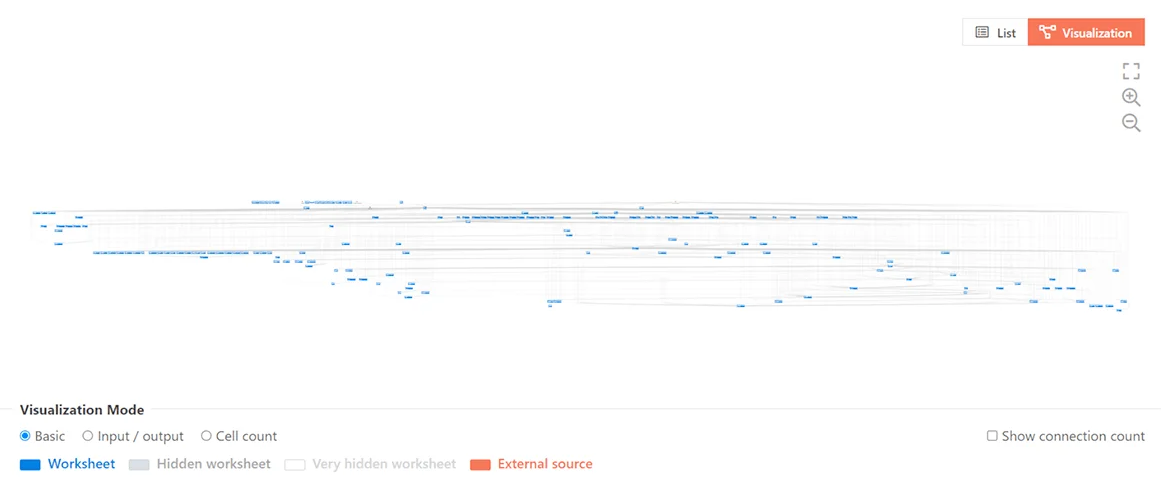
Without any conscious structure choices, your Excel file may at one point look something like this:

Nobody likes to face a spreadsheet like this without some very clear instructions on where they can find what they are looking for.
Here are some tips that relate to creating Excel files with a good structure:
1. Separate input, output, and calculations
In Excel it isn’t immediately clear which cells contain results of formulas and which contain manually entered values, but it is important to keep them properly separated; ideally in separate worksheets, or else through clear formatting. This way you’ll avoid accidentally overwriting calculations with new input data. When it is inevitable to mix the input and output, make sure to give them a distinctive look.
2. Consider the order of your worksheets
Large models often come with many worksheets. Take note of the order in which you place them in Excel. Do you work from left to right? From result to source or from input to conclusion? Every spreadsheet calls for a different approach, but in every case, a consistent, predictable worksheet order makes a model more intuitive to work with.
3. Delete what you don’t need
Just because a spreadsheet is big and complex, doesn’t actually mean it does very much. It happens way too often that an old part of a spreadsheet just keeps existing without any real purpose. When nobody knows exactly why it’s there, nobody will dare to delete it. If you want to keep a model usable and readable, you must remove unnecessary parts. This is where PerfectXL can help a lot. PerfectXL Explore visualizes exactly which worksheets are actively used in the model and how.
4. Don’t take shortcuts
We’ve all said it before, “after the meeting tomorrow, I’ll finish up the model, but it works for now.” In reality this never happens. The next time you need that spreadsheet you’ll be confronted with a situational, temporary solution that hasn’t been properly finished as a model.
5. Don’t be afraid to remodel
Form follows function. If the function of a model changes, so must its form. Don’t turn your spreadsheet into a ‘hack’: if new requirements call for a change in the calculation model, don’t hesitate to apply those changes. Only by keeping your model up to date do you keep it from turning into a convoluted mess.
Note: These tips and many more can be found on our page “Principles for good Excel use”
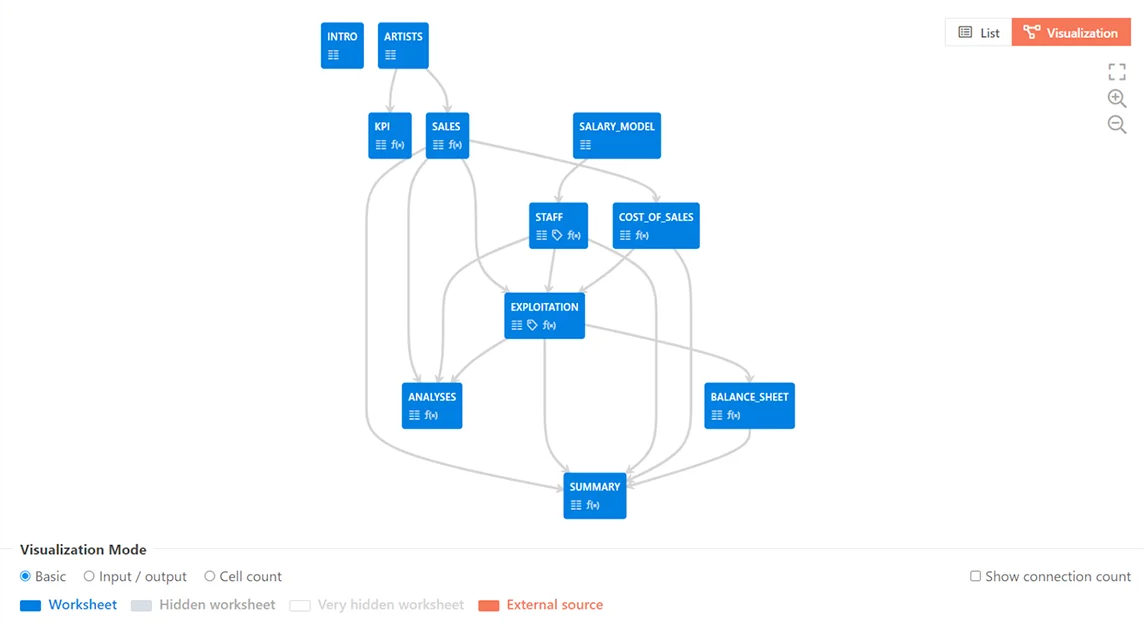
Example of an Excel file with a solid and logical structure
With these tips we hope that soon your structure can start to look more like this:

Of course the comparison with the file above is not entirely fair, because the first file was much more complicated, but we hope that you will learn from the structural clarity.
Visualization of your spreadsheet model
Do you like the visual representations of models you saw in this article? You can generate these for your own models automatically with PerfectXL Explore. This powerful tool visualizes data paths, connections, external sources and much more to help you understand unfamiliar models and to get a better grasp of your own as well. You can request a demo here, or learn more on the PerfectXL Explore product page.
