PerfectXL Highlighter
Automated visual cell type distinction
PerfectXL Highlighter visually distinguishes different cell types, such as cells with hard coded values, cells with formulas and cells with references. Turn different types of ‘highlights’ on and off to visualize the context of your worksheet and to spot irregularities, like broken formula ranges, at a glance.
Read more:
PerfectXL Highlighter
Excel is incredibly powerful in so many ways! Unfortunately a lot of the power is difficult to understand, use, apply, or in many cases even see. For example, a cell shows you an end result, and you can format that end result, but you can’t see (from the overview) how that end result came into existence. Was it a bit of code that put it there? Is it being generated via a formula? Will it change if my inputs change? Does it align with the cells to the left and right of it? Is this cell referenced somewhere else?
All I see is a value, an end total, at least until I select the cell. Like many middle school math teachers, all I can say to Excel is, “show me your work.” The very simplest distinction to make is cells that contain hard values, and cells that are dynamic through things like formulas. This is an issue we tackle with our tool, the PerfectXL Highlighter. It highlights cells to give you more context as to what is actually going on. The standard mode is the “General mode” which simply uses colors to show you data cells, formula cells, and direct references (formulas that just preset a value that they are getting from somewhere else.)
General Mode cell types

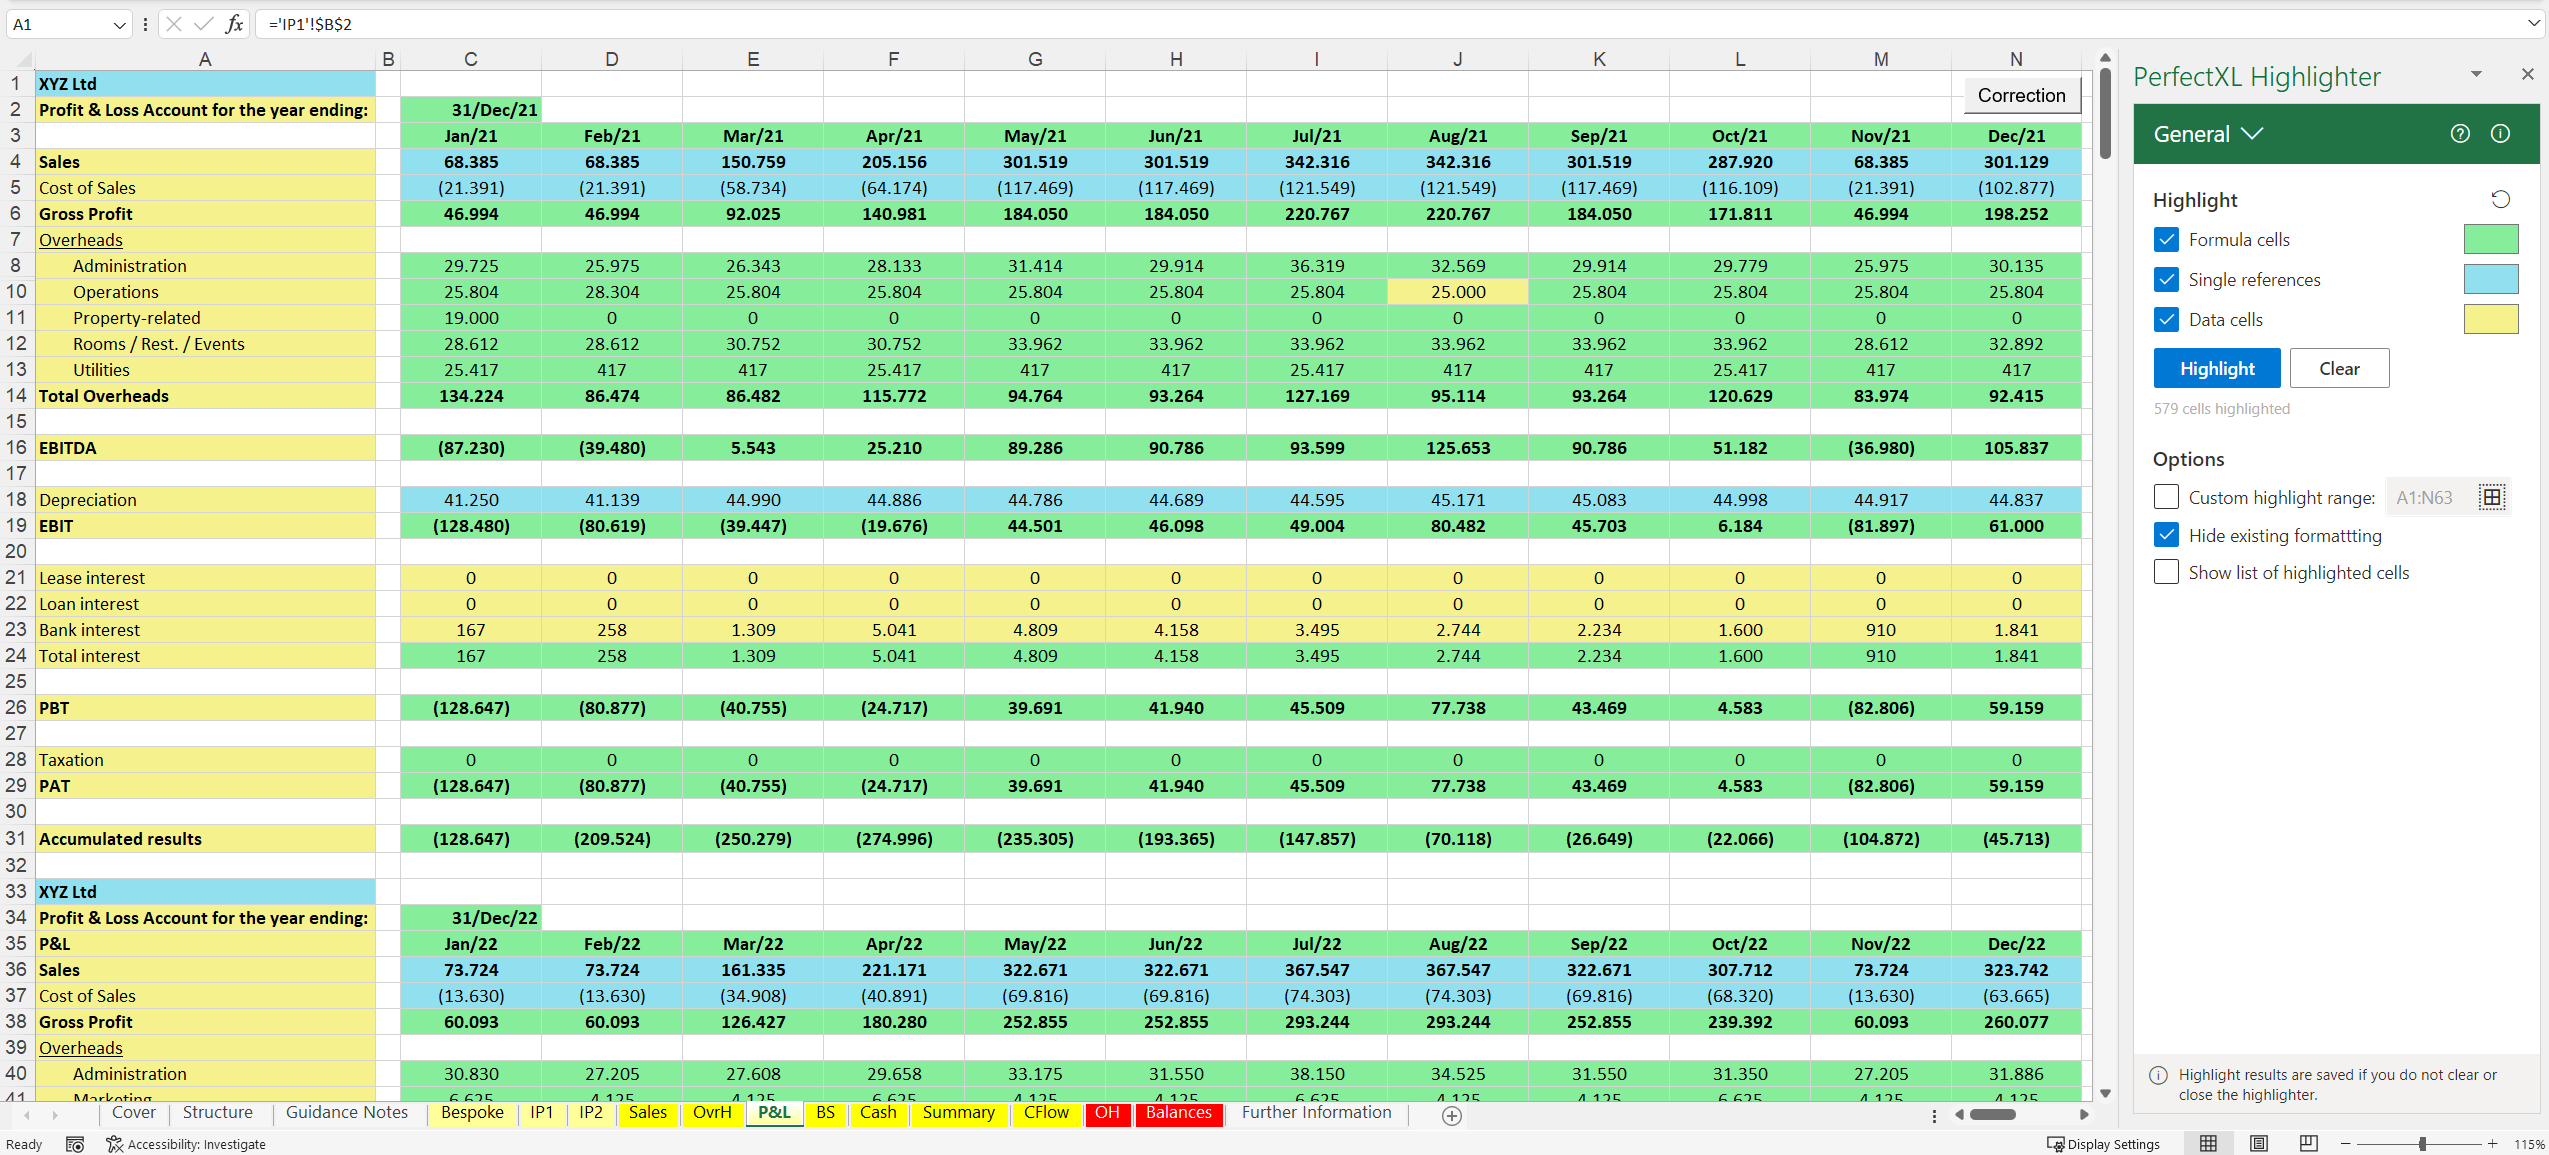
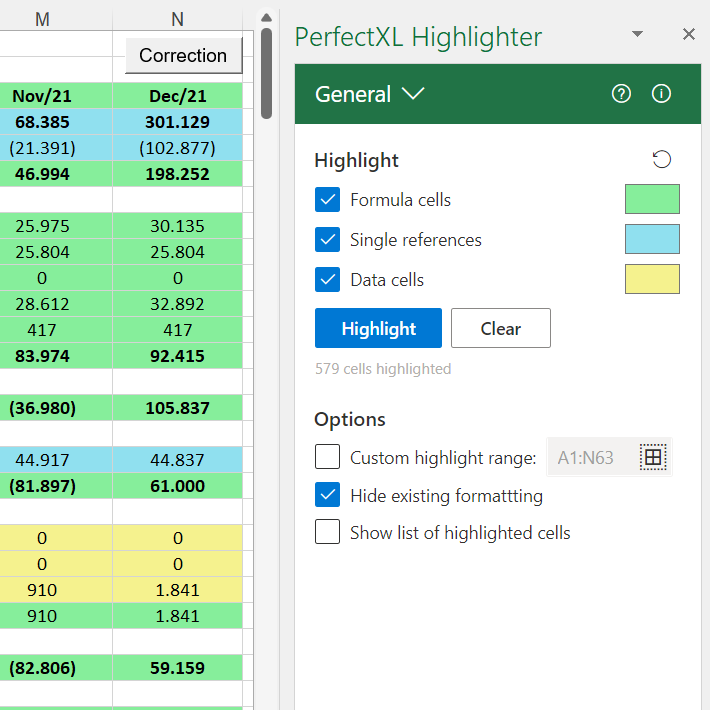
In this picture I’ve selected green for formula cells, blue for single references, and yellow for data. Such a simple way to get so much more information, to see what is actually going on behind the values. For example I can see that cell J10 is yellow, when the surrounding cells are green. How did that data get into that block of formulas? Looks like a mistake to me.
Added value
The highlighter looks and feels simple, but adds so much value and context to every Excel model built. You can get the general mode for free here. Or you can purchase the full highlighter (9 modes in total) here. If you’re not ready to make a decision yet but you want to hear more, you can reach out to me directly at: joel@perfectxl.com
More about the PerfectXL Highlighter tool
On this page you will find a step-by-step walkthrough of the PerfectXL Highlighter. Here we show you what each mode does and how you can use the highlighter to build better spreadsheets.
On this page you will find support and information about the newest PerfectXL tool, the PerfectXL Highlighter! You’ll find information on highlighter requirements, frequently asked questions, and some technical information.
PerfectXL Highlighter visually distinguishes different cell types, such as cells with hard coded values, cells with formulas and cells with references. Turn different types of ‘highlights’ on and off to visualize the context of your worksheet and to spot irregularities, like broken formula ranges, at a glance.


