

Separate input, calculations, and output
An Excel model is more manageable and less error-prone when it has a clear structure leading from input to output. But what do you do if everything is mixed up? PerfectXL visually shows connections and characteristics of tabs and cells. Knowing what’s input and what’s output gives you the knowledge needed to reorganize the model.
- Download the test-file to follow the steps.
- Already working with PerfectXL? Then jump to the solution with PerfectXL.

Step-by-step without PerfectXL
The importance of structure
Nothing is more annoying than opening an unfamiliar model and not being able to decipher how it’s set up. Hopefully you can talk to the original modeller! Maybe they have some documentation on the layout and structure of the model. You can also ask them where core outputs and inputs are, using that information to identify whether or not they are clearly labeled and separated from calculations. But sometimes a model has simply gotten out of hand and the division between inputs and outputs has blurred.
How can you go about ensuring clear structure, separating inputs, calculations, and outputs? How can you even tell where the inputs and outputs are?
Step 1: Trace dependents/precedents
If you know what the core output is, you can trace the calculations back to the beginning. In theory, this leads you to the input fields. You can use “Ctrl + [” to trace precedents or “Ctrl + ]” to trace dependents (you can also find these options under “Formulas” in the main navigation bar). Tracing the path from end result back gives you some insight as to which sheets and cells are involved, and whether or not it’s clear how they are set up.

Step 2: Trial and error
By removing certain elements, separating sheets from the model, or adjusting assumed inputs you can see how changes affect the model. Using this method you can piece by piece find out what a certain sheet or cell is doing, and what impact that has on your end results.

Conclusion
These options can all work; the “Trace Dependents” feature works quite well in certain cases, and if you can talk to the original modeler they can generally offer some insight into a models structure. But in many cases it will be quite hard and time-consuming to decipher an unstructured or messy model manually and tools to help you manage a model become even more valuable.
Step-by-step with PerfectXL
The wonders of technology
The two relevant PerfectXL tools to help you structure an existing file or build a new model from scratch are PerfectXL Explore and PerfectXL Highlighter. PerfectXL Explore immediately provides a high-level overview of the information flow from inputs to outputs in your model. That’s why this plan starts with this tool. Afterwards, you can use the Highlighter on a worksheet in Excel itself: the tool separates all input cells from output cells with a single click and gives both types of cells a recognizable, temporary color.
Step 1: Visualize your model with PerfectXL Explore
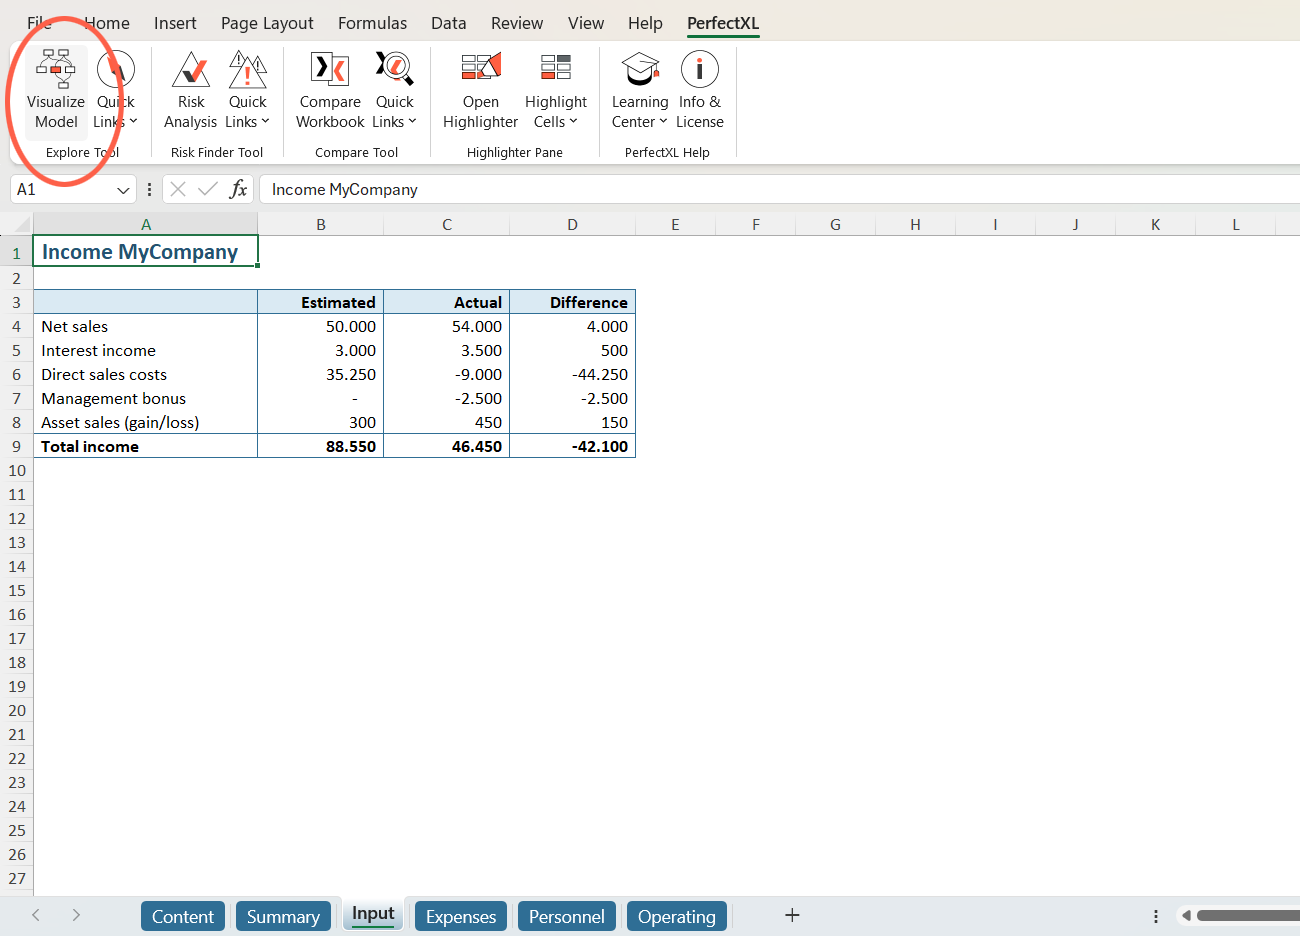
The first step is to evaluate the current separation of inputs, calculations and outputs. Navigate to “PerfectXL” in de main navigation bar of Excel and click “Visualize Model.”
Step 2: Visualize input, output and calculation sheets
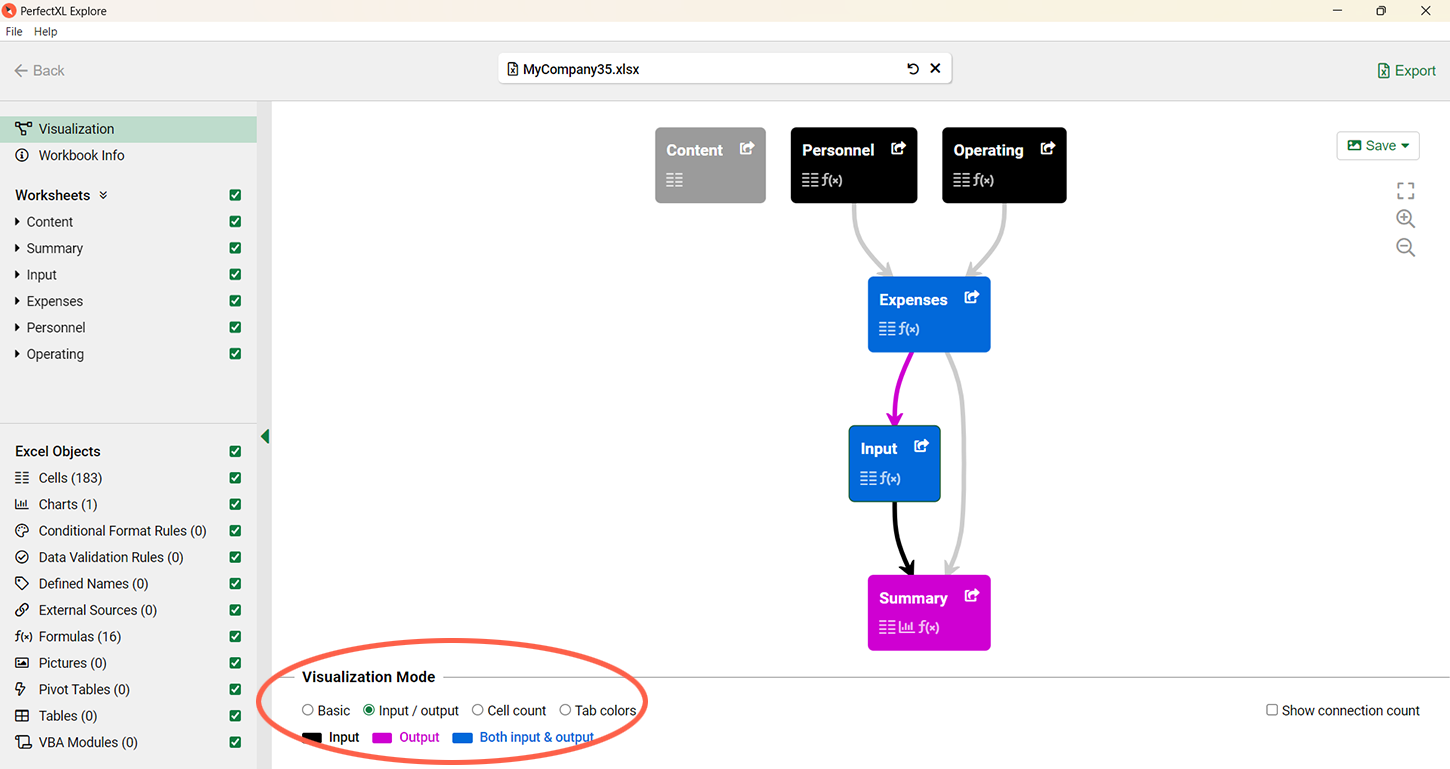
PerfectXL will generate a visualization of your model, showing all worksheets, external sources and their connections to each other. Use the radial buttons at the bottom to select the Input / output mode. Now pure input sheets will be black, calculation sheets will be blue, and outputs will be purple. Any sheet that does not have the expected color should draw your attention.
The sheet labeled “Input” here is shown in blue, let’s further inspect this sheet in Excel to see why it’s not marked black, as the name suggests.
Step 3: Inspect the worksheet
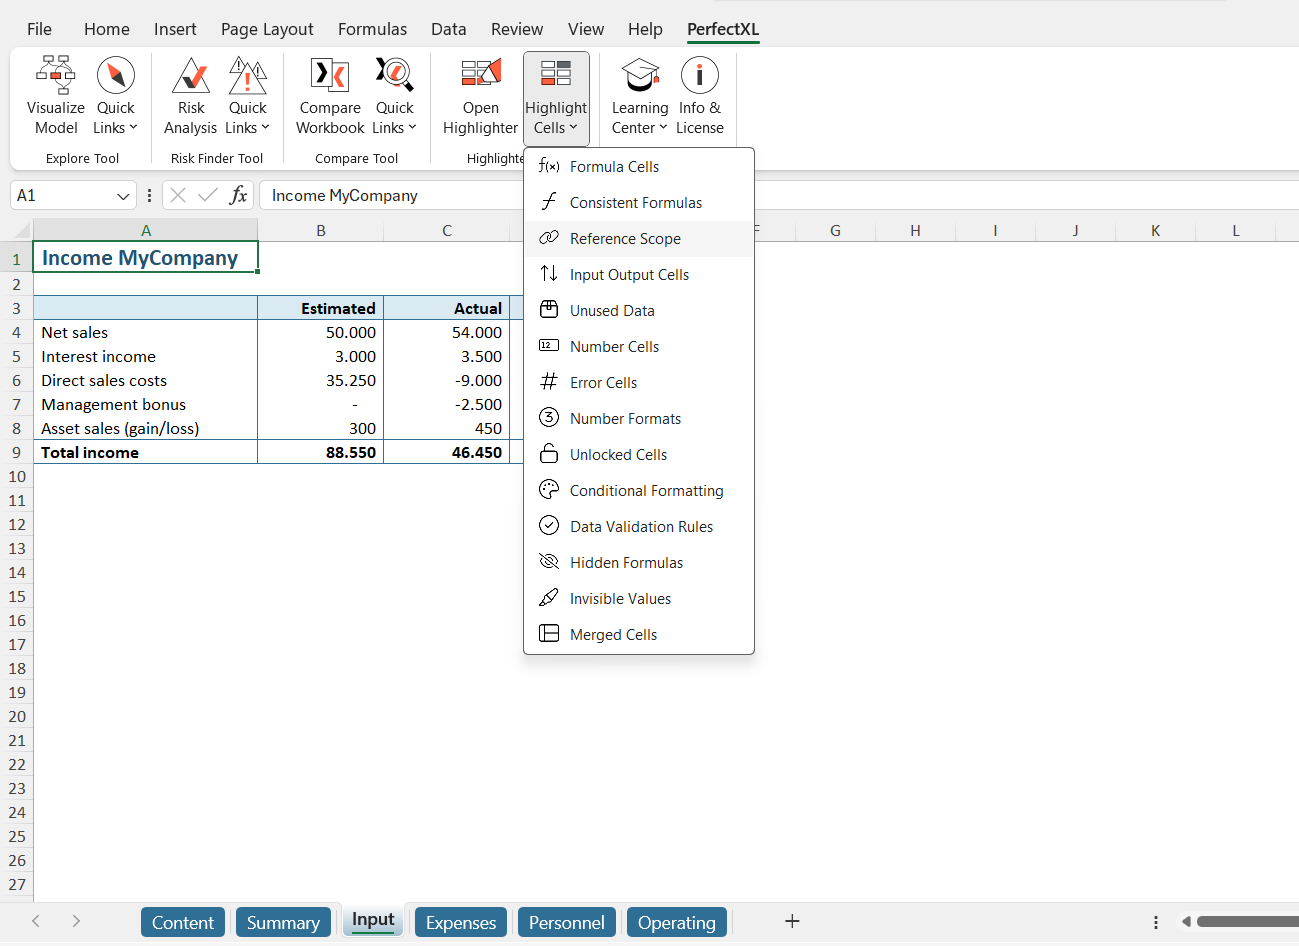
Once on the relevant sheet in Excel we can use the PerfectXL Highlighter to inspect it further. The dropdown under “Highlights Cells” in the PerfectXL ribbon offers us some interesting checks, like the “Input Output Cells” mode which will show us which cells are used or unused, but in this case we are looking for an off-sheet reference, so we’ll choose “Reference Scope.”
Step 4: Detect and fix the issue
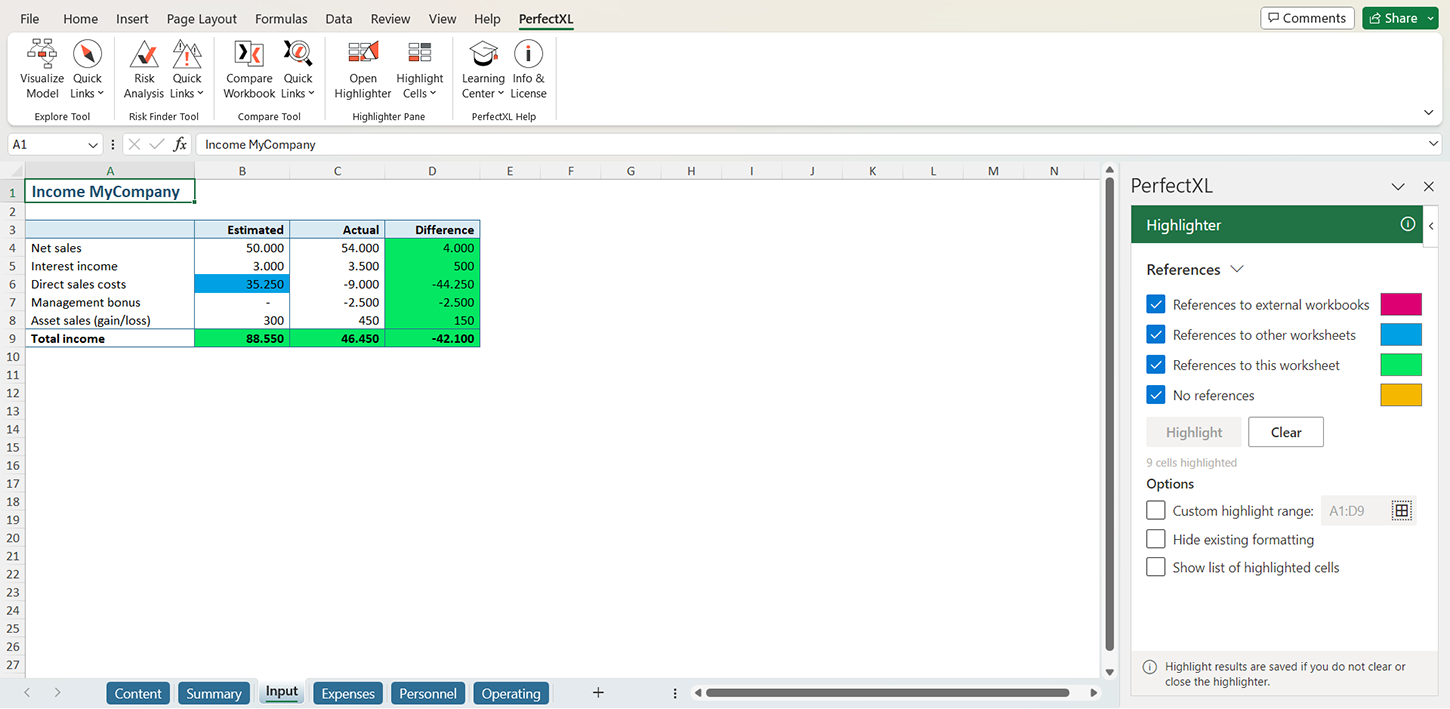
Visually it’s easy to see that one of the cells (B6) on our input sheet is referencing a different tab, which results in an input sheet that is not correctly separated from the calculations of the model. This information will help you get a handle on how to deal with this situation.
Conclusion
As you can see, PerfectXL Explore and PerfectXL Highlighter help users quickly evaluate and create separation between inputs, calculations, and outputs on behalf of a clear structure of the model.