PerfectXL Explore
Finding hidden information in Excel
Excel enables users to hide things, such as rows, columns, formulas, and even whole sheets. This is often done to simplify the “workings” of the model for users that might be less familiar with its structure, or users that simply don’t need to see everything to work with the file. In many cases it’s actually quite a clever solution in which users just see the few cells or sheets that are relevant to them.
Learn more:
PerfectXL Explore
Risks of hidden information
Issues appear when something stops working. For example, if a user unexpectedly adds a column that they weren’t supposed to, runs into an error, and, in attempt to remedy the situation, accidentally deletes or moves crucial information without knowing what they’ve done! On top of all that, the original creator of the spreadsheet might have left the company with little to no documentation on how this model actually works.
Finding hidden information (even very hidden worksheets)
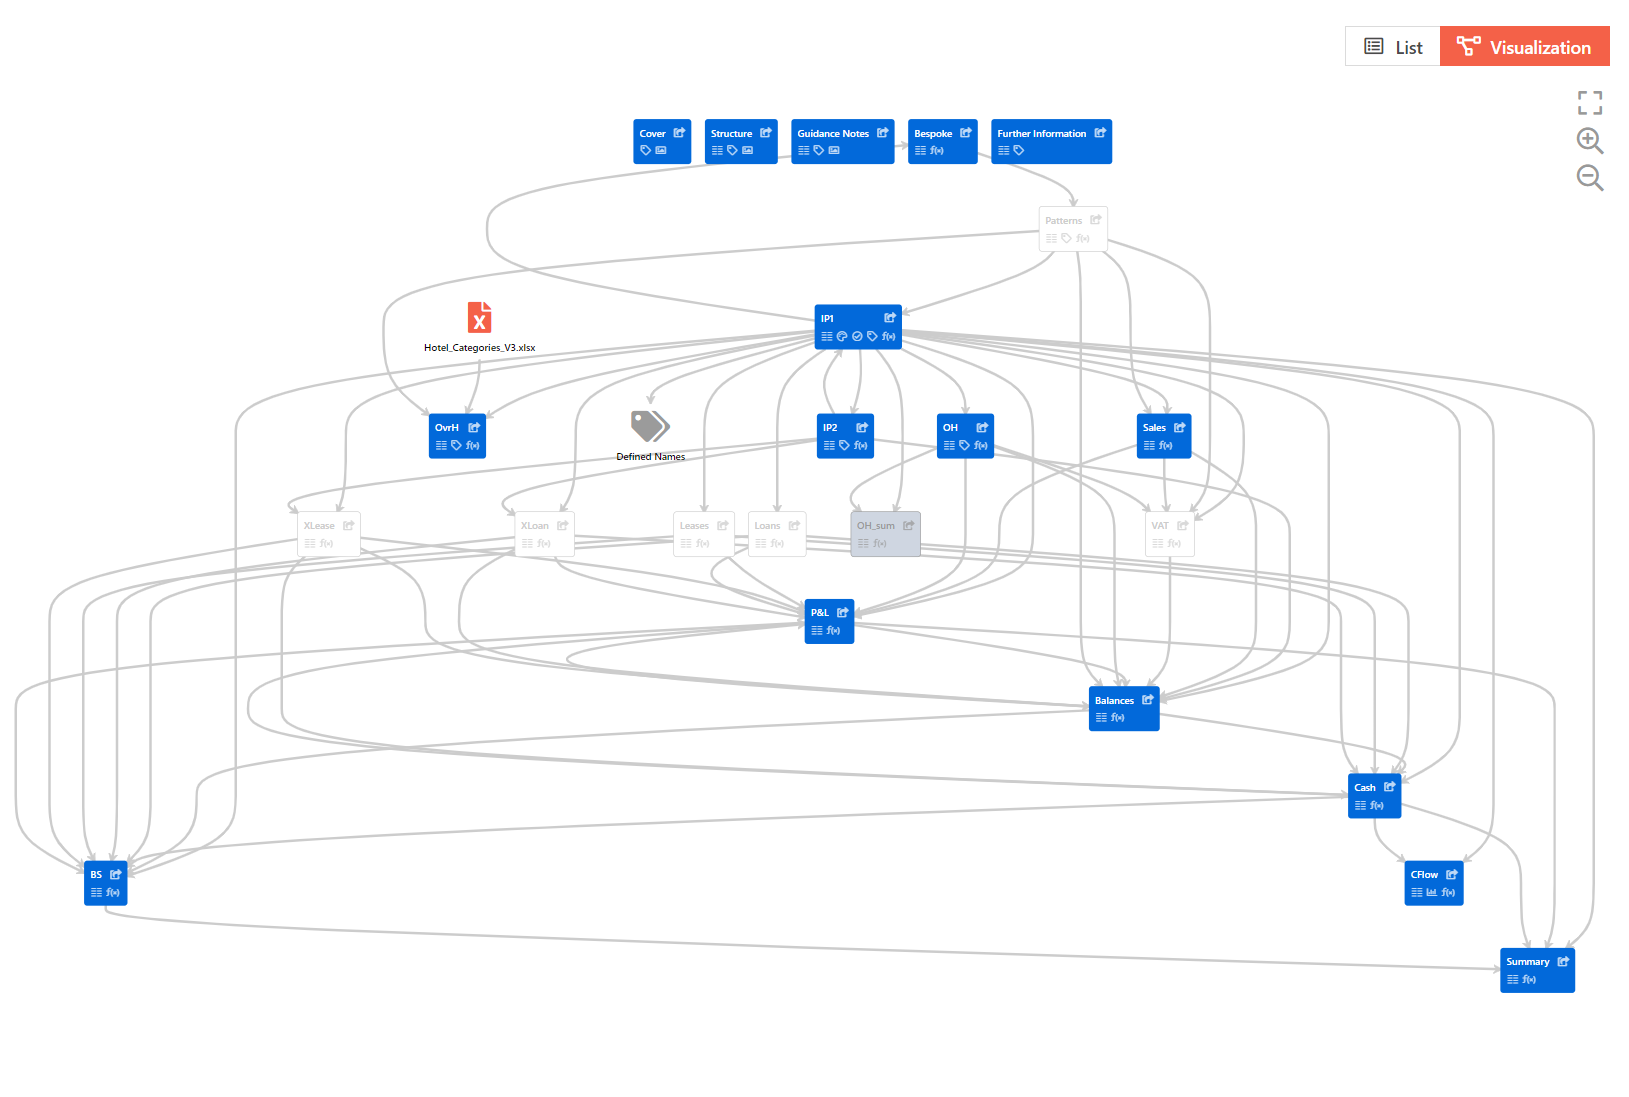
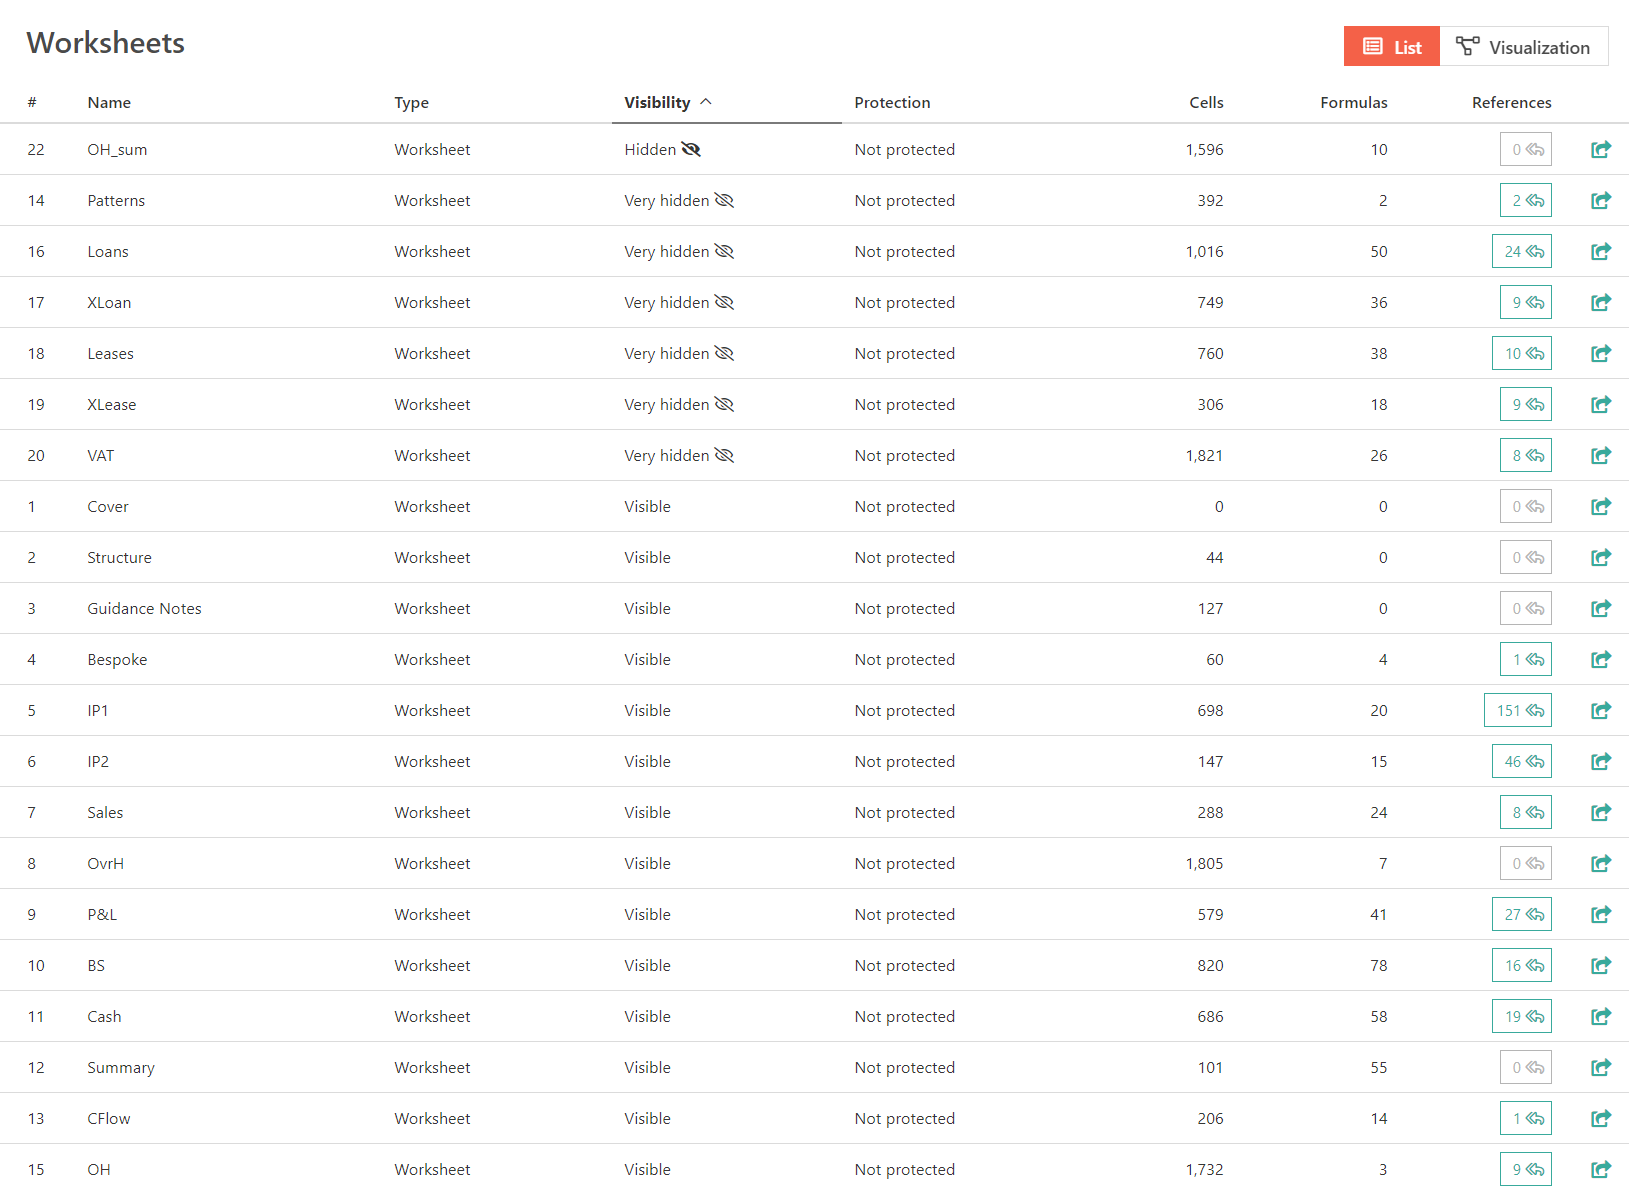
It’s clear that finding hidden information in the spreadsheet you are working with might be crucial to understand its workings. Our tool PerfectXL Explore visualizes the structure of the model, giving you access to all connections between worksheets and showing you exactly where hidden worksheets are and what they are doing. Our tool even reveals very hidden sheets which are not possible to reveal with standard Excel (without VBA).
In PerfectXL Explore a model looks something like this:

You can also access a list of all worksheets and sort by visibility:

The links on the right (in green) allow you to either unhide and open the worksheet in Excel, or to see all links to that sheet in your model. This allows you to understand how these hidden worksheet are interacting with the rest of your model.
As with most things in Excel, this isn’t some “quick hack”. You’ll still have to roll up your sleeves and get to work, but like most battles, in this case knowing is half the battle!
More articles related to PerfectXL Explore
On this page you will find a step-by-step walkthrough of the PerfectXL Explore Tool. This page will give you information on how you can use explore to gain a better understanding of complex Excel files.
This is the technical page for PerfectXL Explore. Here you will find information like system requirements, release notes, and answers to most questions about our software. If you have more questions please use the form at the bottom of the page.
In this video we’ll show you how to run a quick basic check of the input sources of your Excel files and how to determine if there is any unknown input. We’ll also show you a powerful way to visualize your spreadsheet’s information flow to help determine the function and dependability of each worksheet.
Garbage in, garbage out. So pay serious attention to cleaning your input data as it is the foundation of your spreadsheet and if possible, do it in such a way that it becomes an automated process for the next time you use the same spreadsheet.
Treat transferring a spreadsheet like you would treat the process of renting your house via Airbnb. Most people realize it will stay neater if you clean it first. Mess stimulates mess, and neatness stimulates neatness. Remember that in an average spreadsheet there will be 12 different users that have to use it after you! What do you think happens when this chain starts with a messy file?
Excel enables users to hide things, such as rows, columns, formulas, and even whole sheets. In many cases it’s actually quite a clever solution in which users just see the few cells or sheets that are relevant to them.
Curious to see what your spreadsheet’s all about? PerfectXL Explore gives you a great starting point. An overview of worksheets, input sources and potential risks are all part of our general spreadsheet characteristics section. It also gives you an insight into the amount of formulas used in your spreadsheet.
In this article we’ll discuss some good practices that will help you with structuring your Excel files.
Be honest with yourself, how much time does it take you to spit through an Excel file? The opportunities in Excel are endless but this comes with a downside. PerfectXL has the solution. Starting now you can gain a better understanding of your spreadsheets, to help you in improving, documenting, and cleaning up your files. Here are 9 tasks that PerfectXL Explore makes easy.
When we read a book or a report or a website, we read from top to bottom and from left to right. Keep this in mind when you create an Excel file. Try your best to follow that structure both within each worksheet and between them. We advise you to distinguish separate input & output sheets as well as sheets for calculations, documentation and dashboards.
Understanding the workings of a spreadsheet is key to correctly interpreting its results. Spreadsheet visualization is an essential feature of PerfectXL Explore. It allows you to create a graphical model of the general flow of information, which also shows of risks, input & output and data & formula flows.
Numbers without meaning are worthless. Excel is a program for numbers, but it is only useful if it is clear to the reader or user what these numbers mean. So, make sure that you provide textual information for all data and formulas, let’s call these pieces of text information labels.
Named Ranges make it clear to users what value is being referred to and it allows you to update it globally if it changes. Only one question remains… Where is my Named Range used?


