
PerfectXL Explore
Generate logical navigation for your Excel file
Navigating quickly between the worksheets of a complex Excel model can be tiresome. PerfectXL Explore helps you generate logical navigation for your Excel file in seconds, visualizing the input, output and calculation sheets.
Learn more:
PerfectXL Explore
Robust Excel models
Excel somehow manages to be both very dynamic and very linear at the same time. A good Excel model should be robust: with clear inputs on one end, clear outputs on the other, and dynamic calculation steps in between, that continue to work even after the model changes.
The horizontal organization of worksheets
Why then are worksheets all lined up in a little row in the bottom of your screen, making it tough to jump from input to output sheets? If you have worked in a complex Excel model you know that it can be tiresome to navigate quickly between tabs. You can easily get lost in a web of interconnected formulas and references. This is, in large part, simply because of the interface.
Ideal situation
What if the Excel model wasn’t flattened into a simple row of worksheets with names, but rather presented to you in a format that makes sense. With inputs at the top, outputs at the bottom, and clear visual clues throughout as to which references, formulas, charts, or other objects are on each sheet. Personally, I think it makes navigating through a model easier, and I enter a sheet with so much more context and confidence that I will find what I’m looking for.
It’s so important, also when we relate it to one of our Principles for good Excel use:
Choose a uniform architecture
Spreadsheets can last for many years. That’s why it’s critical to choose an architecture that suits all the functional requirements. Architecture concerns the choices made with regards to the modelling of your Excel file. For example, an architectural decision is to always have a separate input worksheet for database imports, or to consistently have an ID-column to the left of your data.
Generate navigation through visualization
Thinking about your Excel model as if it was a house or a building can help give your model a logical structure and make it much easier to work with. As with any good house development, you’ll need a blueprint. Our tool PerfectXL Explore helps you generate logical navigation for your Excel file, visualizing the input, output and calculation sheets, as well as their connection to each other:
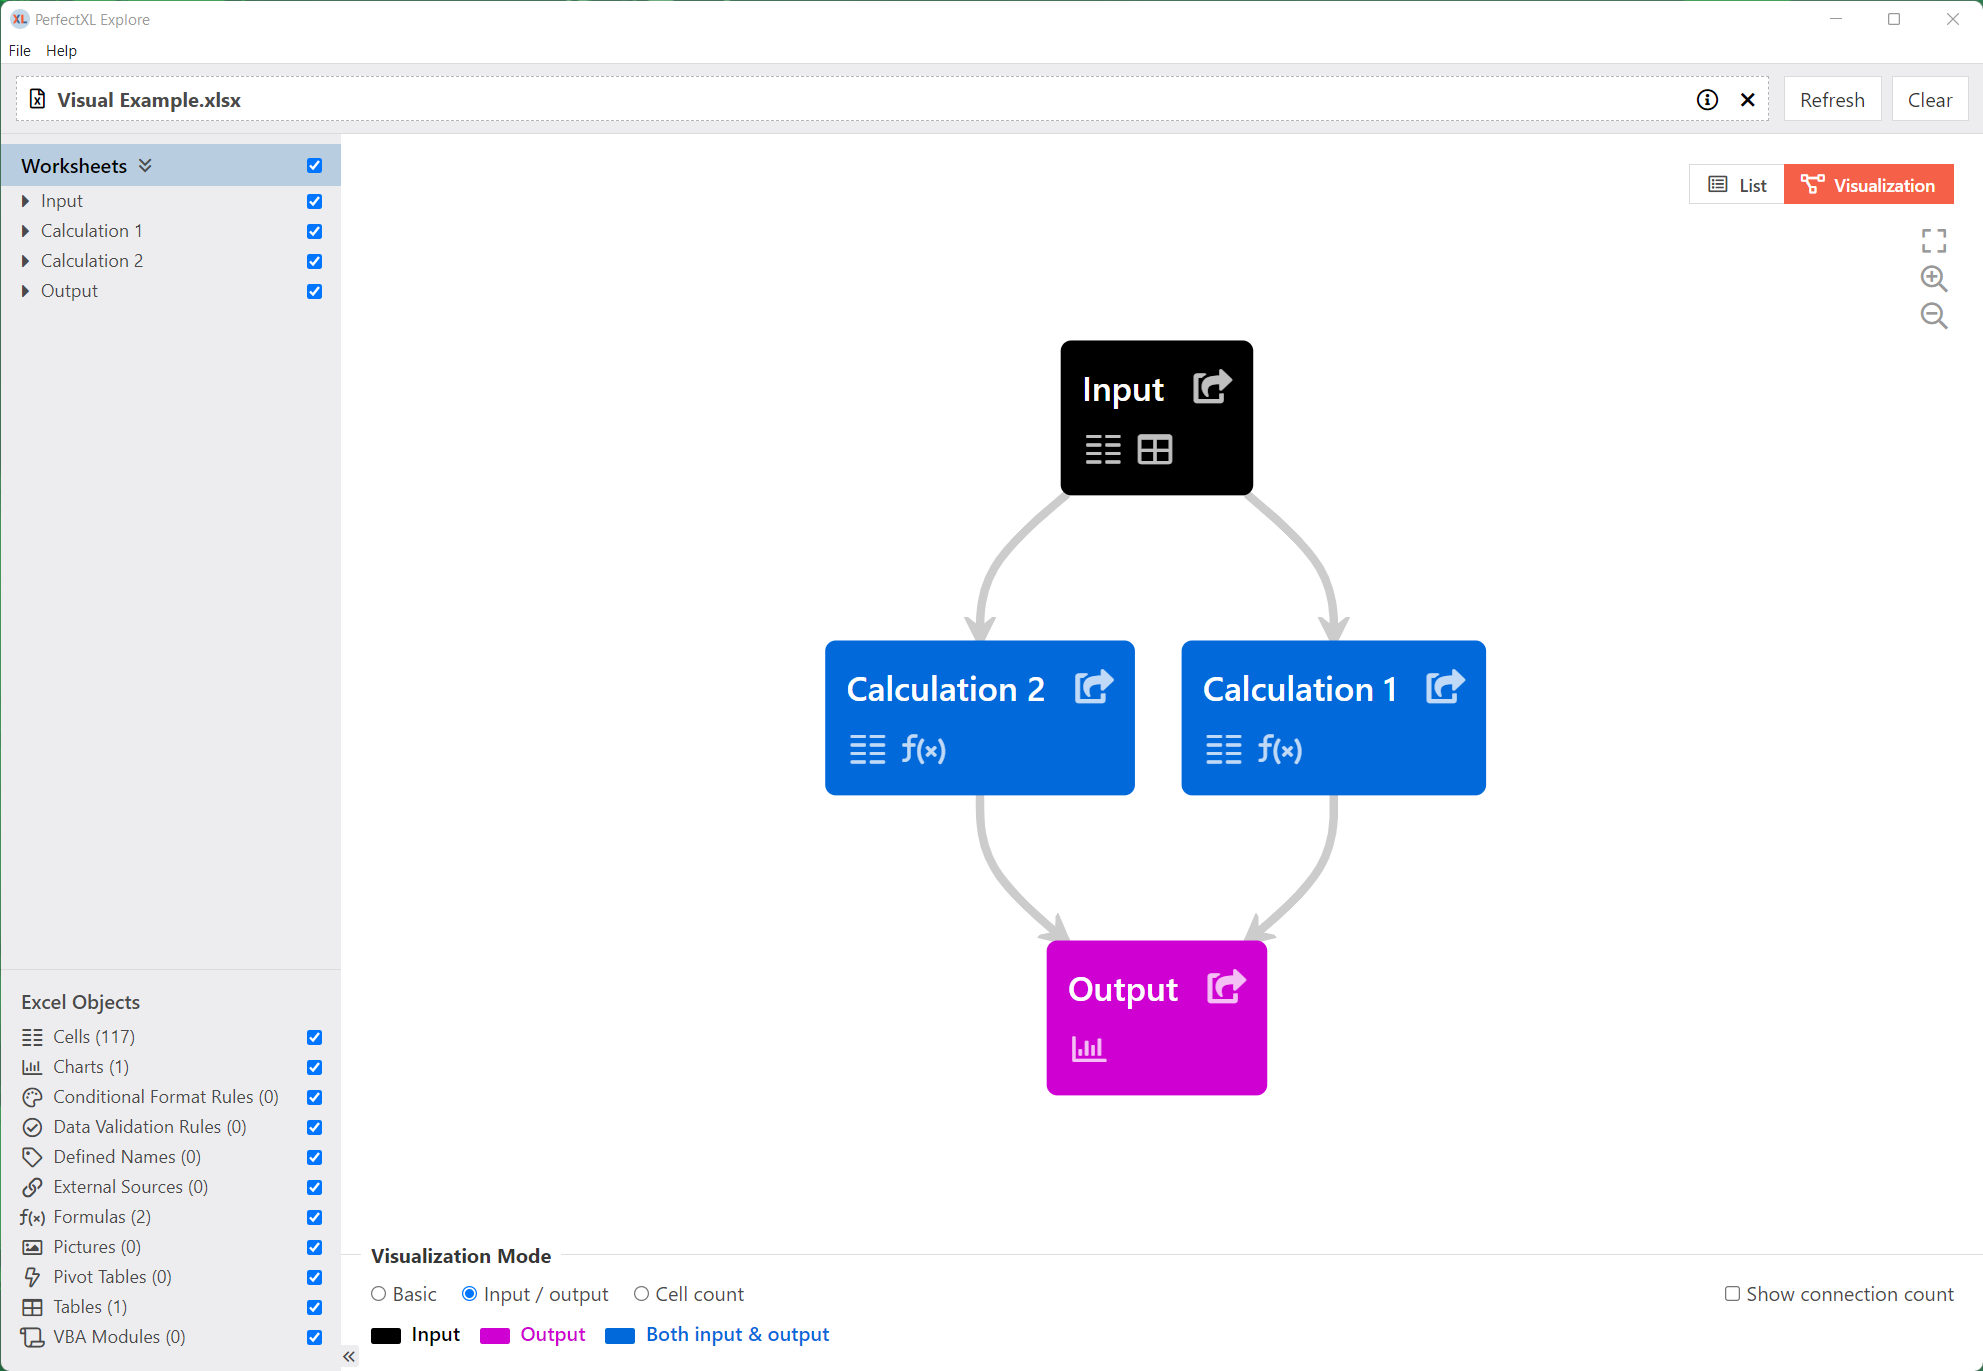
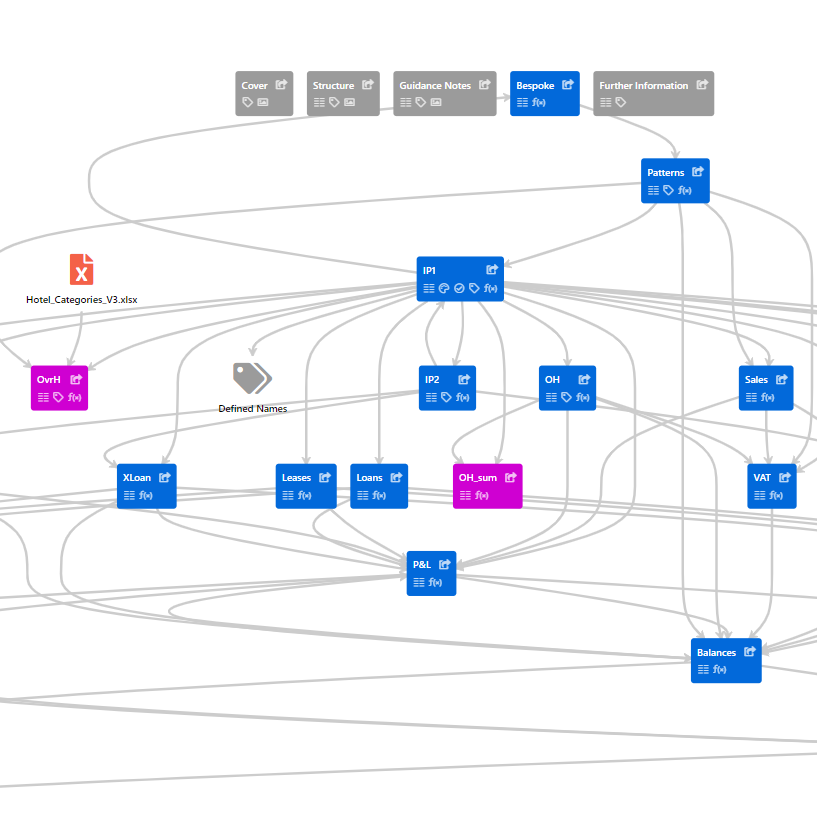
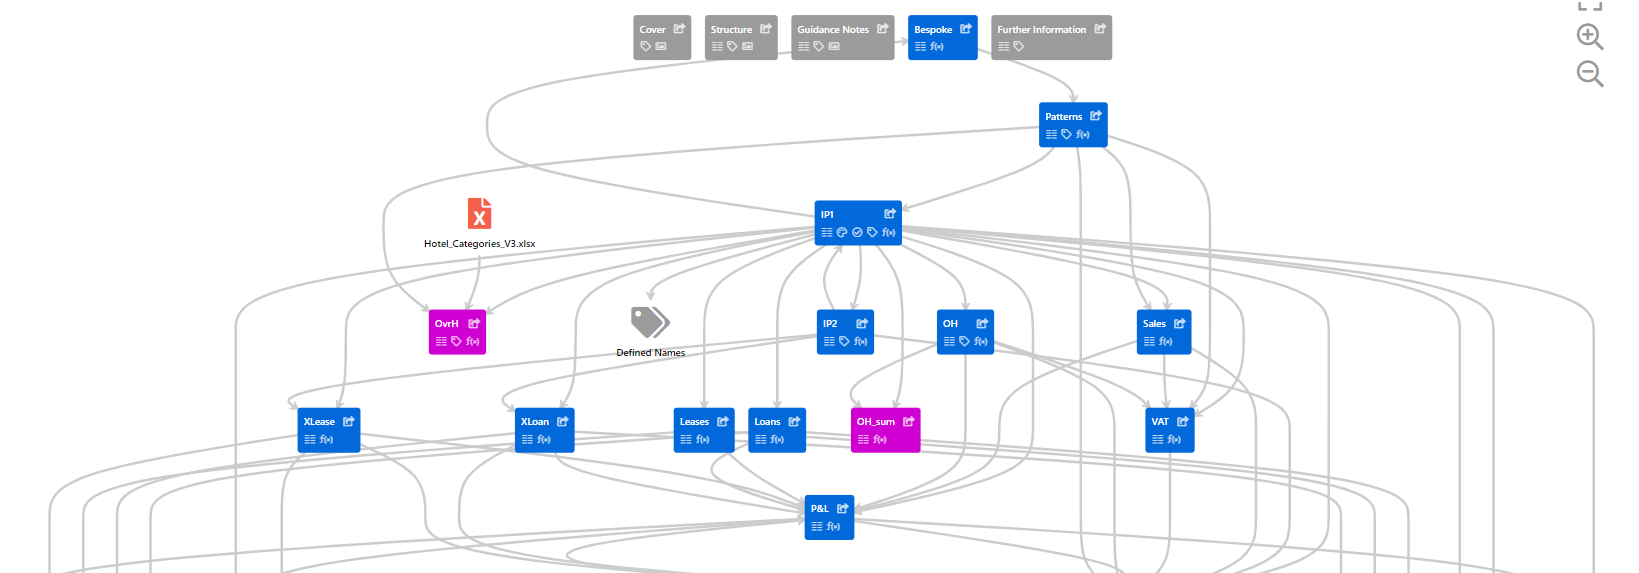
A very simple visualization will look something like the image above, whereas your models will probably look something more like:
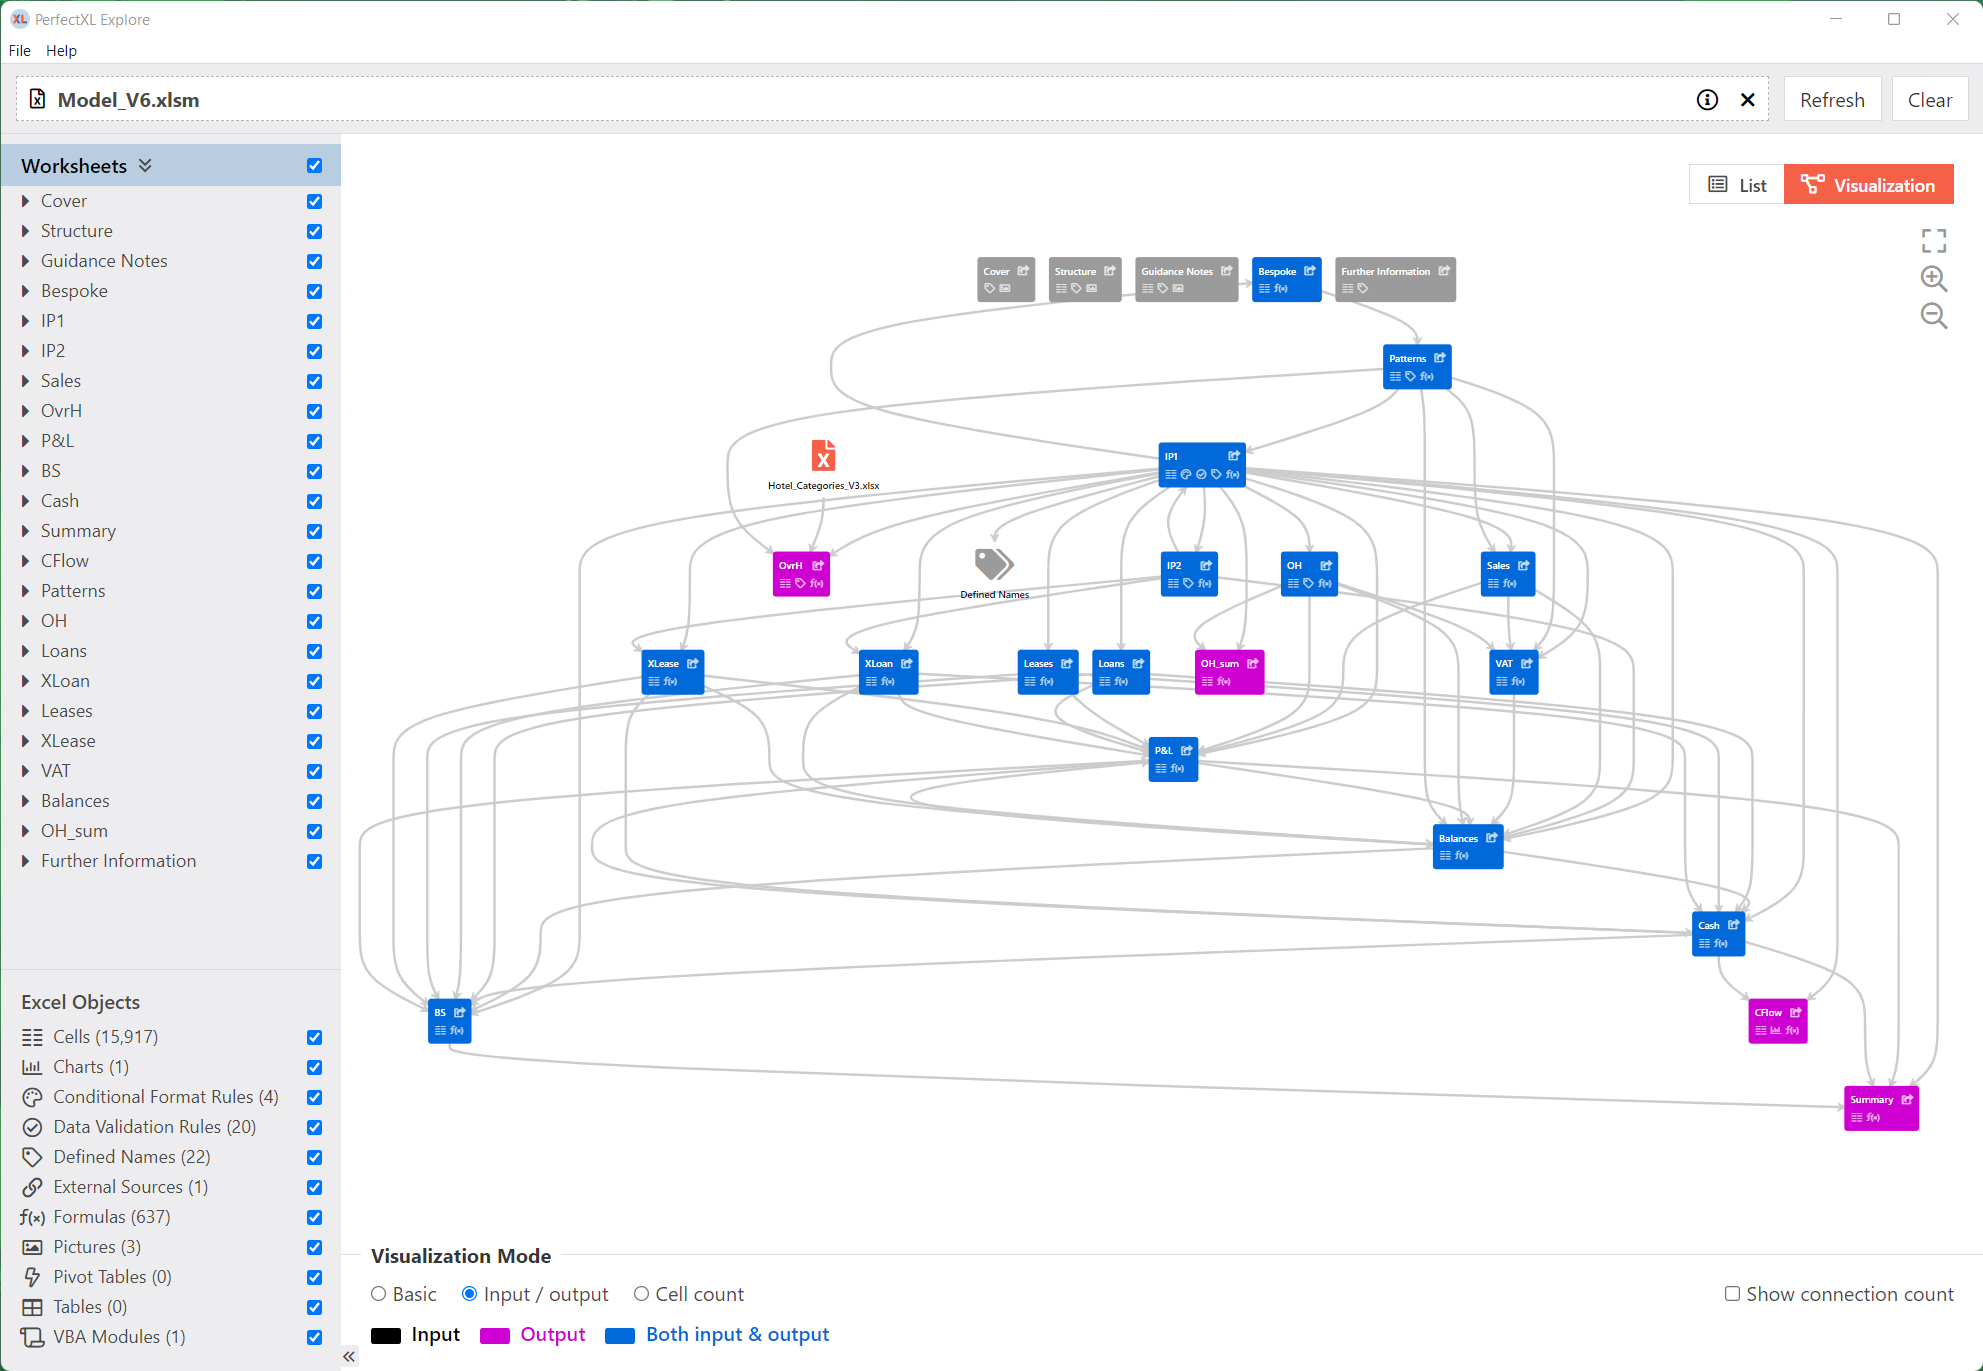
Either way, having this view gives you a much better understanding of how your model works and gives you more confidence to navigate from tab to tab as you can directly navigate to your own Excel model from the tool. These links are laid automatically and allow you to access the deep secrets of you model in seconds!
How about a free trial?
If you’re interested in this tool you can download a free trial from the microsoft store, or you can contact us directly for a trial and some more information. Reach me at joel@perfectxl.com, I look forward to hearing from you!
More articles related to PerfectXL Explore
On this page you will find a step-by-step walkthrough of the PerfectXL Explore Tool. This page will give you information on how you can use explore to gain a better understanding of complex Excel files.
This is the technical page for PerfectXL Explore. Here you will find information like system requirements, release notes, and answers to most questions about our software. If you have more questions please use the form at the bottom of the page.
In this video we’ll show you how to run a quick basic check of the input sources of your Excel files and how to determine if there is any unknown input. We’ll also show you a powerful way to visualize your spreadsheet’s information flow to help determine the function and dependability of each worksheet.
Garbage in, garbage out. So pay serious attention to cleaning your input data as it is the foundation of your spreadsheet and if possible, do it in such a way that it becomes an automated process for the next time you use the same spreadsheet.
Treat transferring a spreadsheet like you would treat the process of renting your house via Airbnb. Most people realize it will stay neater if you clean it first. Mess stimulates mess, and neatness stimulates neatness. Remember that in an average spreadsheet there will be 12 different users that have to use it after you! What do you think happens when this chain starts with a messy file?
Excel enables users to hide things, such as rows, columns, formulas, and even whole sheets. In many cases it’s actually quite a clever solution in which users just see the few cells or sheets that are relevant to them.
Curious to see what your spreadsheet’s all about? PerfectXL Explore gives you a great starting point. An overview of worksheets, input sources and potential risks are all part of our general spreadsheet characteristics section. It also gives you an insight into the amount of formulas used in your spreadsheet.
Navigating quickly between the worksheets of a complex Excel model can be tiresome. PerfectXL Explore helps you generate logical navigation for your Excel file in seconds, visualizing the input, output and calculation sheets.
In this article we’ll discuss some good practices that will help you with structuring your Excel files.
Be honest with yourself, how much time does it take you to spit through an Excel file? The opportunities in Excel are endless but this comes with a downside. PerfectXL has the solution. Starting now you can gain a better understanding of your spreadsheets, to help you in improving, documenting, and cleaning up your files. Here are 9 tasks that PerfectXL Explore makes easy.
When we read a book or a report or a website, we read from top to bottom and from left to right. Keep this in mind when you create an Excel file. Try your best to follow that structure both within each worksheet and between them. We advise you to distinguish separate input & output sheets as well as sheets for calculations, documentation and dashboards.
Understanding the workings of a spreadsheet is key to correctly interpreting its results. Spreadsheet visualization is an essential feature of PerfectXL Explore. It allows you to create a graphical model of the general flow of information, which also shows of risks, input & output and data & formula flows.
Numbers without meaning are worthless. Excel is a program for numbers, but it is only useful if it is clear to the reader or user what these numbers mean. So, make sure that you provide textual information for all data and formulas, let’s call these pieces of text information labels.
Named Ranges make it clear to users what value is being referred to and it allows you to update it globally if it changes. Only one question remains… Where is my Named Range used?